How to set up a Grafana analytics dashboard based on ROCK 3A SBC
Author: Peter Milne, engineer and Linux advocate with probably more SBCs than a Chandrayaan-3 moon lander
This project introduces detailed step-by-step instructions on how to set up a Grafana analytics dashboard based on ROCK 3A SBC. It continues our series of setting ROCK boards in an industrial context, showcasing innovative IIoT solutions that can integrate into existing industrial automation, smart agriculture and building management infrastructure or form the building blocks for new solutions.
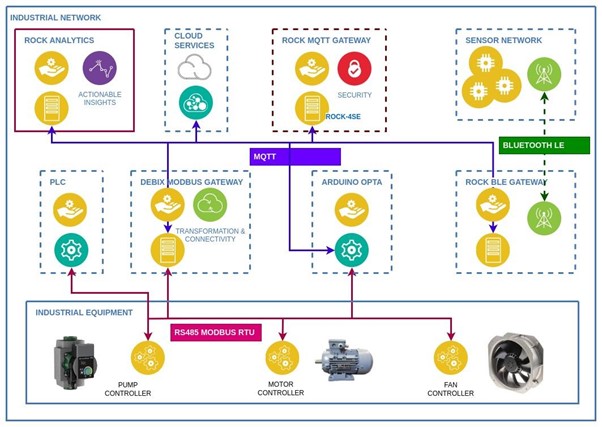
This time, we added InfluxDB and Telegraf to the ROCK 4SE MQTT server built in a previous project to enable capturing sensor data and storing it in a database. The data is then available across the network to other clients.
We also introduce a new network node based on the ROCK 3A connected to a Raspberry Pi 7 inch Touch Screen and use Grafana to build useful dashboards to analyse and present the sensor data to users.
Let’s view below an overview of this project before we go into step-by-step detailed instructions:
Step 1: Hardware
You could use either the ROCK 3A or ROCK 3C boards for this project depending on network connectivity requirements.
They both have a small form factor, great network throughput and more than enough CPU and memory resources for this application and support both SD card and eMMC storage.
I tested it on the ROCK 3A with 2GB RAM. This is based on the Rockchip RK3568 SoC, a 64-bit, quad-core Armv8.2‑A Cortex®‑A55 CPU running at 2.0GHz. A 4GB RAM version is also available.
Both boards fit nicely into the Raspberry Pi 7 inch Touchscreen Display case with only light modification, making it easy to deploy them.
Step 2: Debian Bullseye
Radxa supplies a 64-bit Debian Bullseye Xfce desktop image for the ROCK 3A. This has the driver for the Raspberry Pi 7 inch Touch Screen display.
Visit the Radxa GitHub and download the latest image for the ROCK 3A, then flash it to a micro SD card or, even better, an eMMC module.
Discover detailed instructions about how to configure the Raspberry Pi 7 inch display with ROCK boards.
Step 3: InfluxDB
This project needs an MQTT broker. We showed how to build a MQTT broker using the ROCK 4SE in a previous project.
In addition to hosting the Mosquitto broker, we will add InfluxDB to act as our database for storing the sensor data. This allows data published to the broker to be shared by multiple devices on the network. So, for example, you could have the same information being displayed near to the plant or equipment being monitored as well as in a control centre.
Because we are saving data to a database, we moved the root filesystem on the ROCK 4SE onto an NVMe SSD, as this is a more suitable storage medium. Details of how to do this are covered in this guide on how to add NVMe SSD storage to ROCK Single Board Computers.
Installing InfluxDB on Debian involves downloading the package from Influxdata – access the instructions here.
Open a Terminal session on the ROCK 4SE broker and get the package for Arm64, then install it:
$ wget https://dl.influxdata.com/influxdb/releases/influxdb2-2.7.1-arm64.deb
$ sudo dpkg -i influxdb2-2.7.1-arm64.deb
Note: The current InfluxDB2 version is 2.7.1 – this will change, so the commands above will need to match the latest version.
The installation script enables the influxdb.service, but it doesn’t run it, so start it up and check it’s running:
$ sudo systemctl start influxdb.service
$ systemctl status influxdb.service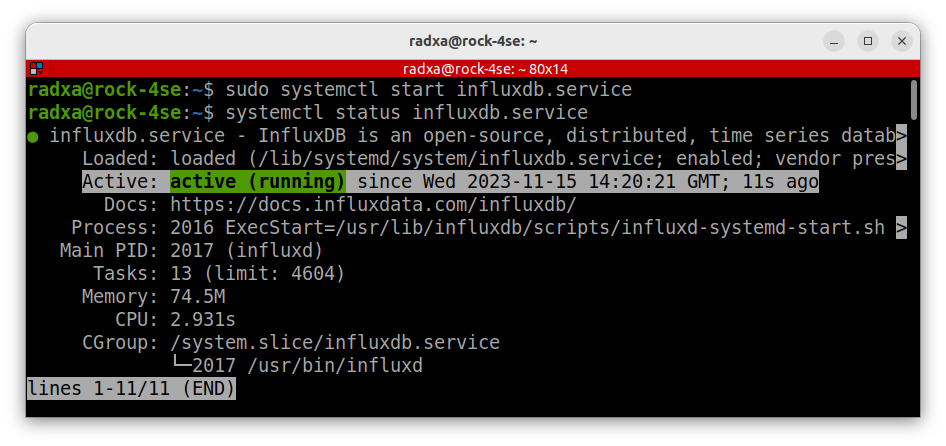
Step 4: InfluxDB CLI
InfluxDB CLI provides all the tools required to administer the database from the command line. We will use it to set up users for our different applications and to administer our databases.
Install it on the ROCK 4SE from a Terminal session:
Download the CLI client for Arm64, extract the binary and copy the client to the local bin directory:
$ wget https://dl.influxdata.com/influxdb/releases/influxdb2-client-2.7.3-linux-arm64.tar.gz
$ mkdir influxdb-client
$ tar xvzf influxdb2-client-2.7.3-linux-arm64.tar.gz -C influxdb-client
$ sudo cp influxdb-client/influx /usr/local/bin/
Now initialise the InfluxDB by creating an admin user, passing in parameters for the organisation and primary bucket to store data in:
$ influx setup
  --username 'influx-admin'
  --password '123456-xyz'
  --org 'okdo-projects'
  --bucket 'sensors'
  --force
This generates an API Token for the admin user stored in ~/.influxdbv2/configs and makes this token available for that user when running the CLI client.
Then, create a separate user to manage the Telegraf agent that we will install next. This user will have fewer access rights. Another user token is generated, which we can view later using the CLI tools:
$ influx user create -n 'telegraf' -p '123456-xyz' -o 'okdo-projects'
$ influx auth create
  --org 'okdo-projects'
  --user 'telegraf'
  --read-buckets
  --write-buckets
  --read-telegrafs
  --write-telegrafs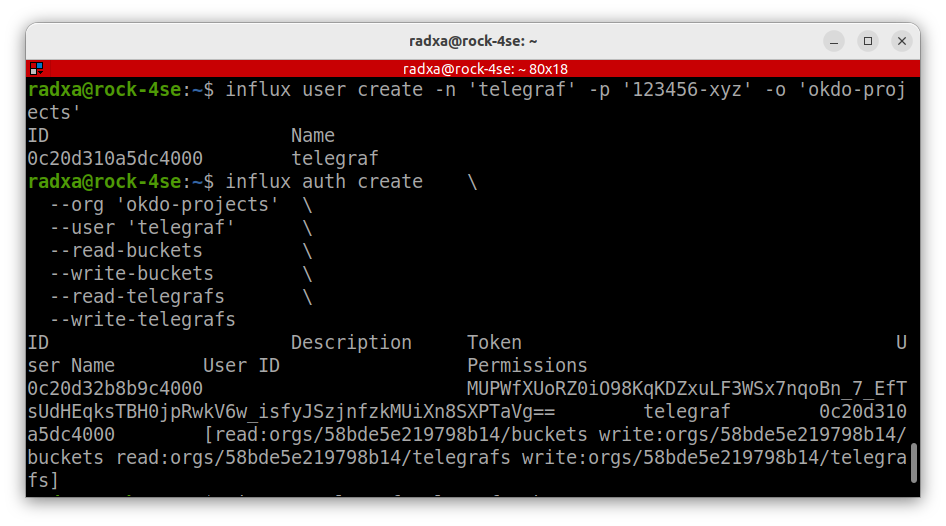
Step 5: Buckets
For testing purposes, we will create a separate bucket in InfluxDB to hold test data. It doesn’t need to store it for long, so this is the command to create a new bucket named test:
$ influx bucket create --name "test" --org "okdo-projects" --retention 72hGrafana, which we will install later, follows InfluxDB 1.x conventions to query InfluxDB 2.7 buckets so we need to create DBRP (Data Base Retention Policy) mapping for the target bucket.
Obtain the bucket ID for the test bucket with the following command:
$ influx bucket list
ID			Name		Retention	Shard group duration
…
c0c1d28874a81446	test		72h0m0s		24h0m0s
Then, create a DBRP mapping for the test bucket where the name is mapped to test-rp using the bucket ID from above:
Note: Grafana uses the mapped name for the bucket, which we will use later.
$ influx v1 dbrp create
  --db test
  --rp test-rp
  --bucket-id c0c1d28874a81446
  --default
We can check the mapping by using this list command:
$ influx v1 dbrp list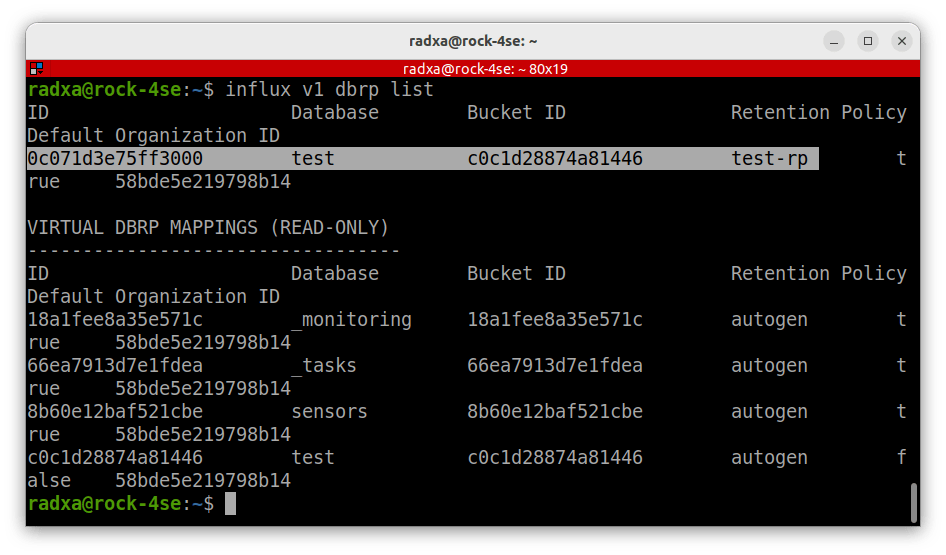
A final step before we leave InfluxDB is to create a separate InfluxDB user for Grafana. So create a new user as before, but give it even fewer access rights.
Create the user first:
$ influx user create -n 'grafana' -p '123456-xyz' -o 'okdo-projects'Then grant the grafana user read only access rights to just buckets:
$ influx auth create
  --org 'okdo-projects'
  --user 'grafana'
  --read-buckets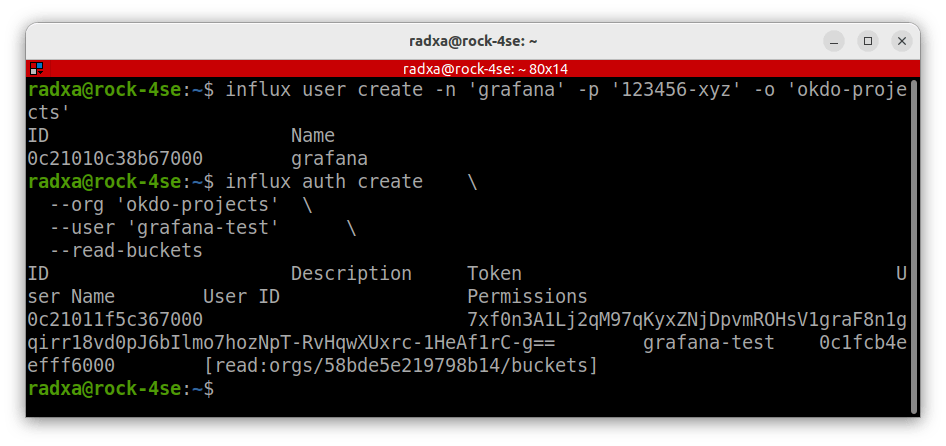
Step 6: Telegraf
Telegraf is an Open Source software agent by Influxdata that supports ingesting data from many different sources into InfluxDB. It has a plug-in for MQTT protocol plus many more.
We will install it on the ROCK 4SE host and use it to capture the sensor data published to the MQTT broker into InfluxDB.
Visit the Telegraf home page and click the download button to get the URL of the latest version for Linux on ARMv8.
In a Terminal session on the ROCK 4SE, download the latest tarball:
$ wget https://dl.influxdata.com/telegraf/releases/telegraf-1.28.2_linux_arm64.tar.gzThis command extracts the archive and copies it to the correct locations in the root filesystem by stripping off the first 2 leading directories from the archive path:
$ sudo tar xzvf telegraf-1.28.2_linux_arm64.tar.gz --strip-components=2 -C /Note: Before executing the above command, check the tarball structure in case it changed in future versions:
$ tar tf telegraf-1.28.2_linux_arm64.tar.gzStep 7: Test Data
As this is a complicated application stack, to make testing easier a bash script can be used to mock the sensor data being sent over MQTT.
On the ROCK 4SE, create the script below named random-temp.sh. It generates two random temperatures and publishes them in CSV format on separate topics every 10 seconds:
$ vi random-temp.sh#!/bin/bash
# Publish random temperature values between 0 & 19.9 over MQTT
while true; do
a=0; b=20
t1=$((a+RANDOM%(b-a))).$((RANDOM%9)); echo "T1: $t1"
t2=$((a+RANDOM%(b-a))).$((RANDOM%9)); echo "T2: $t2"
mosquitto_pub -h rock-4se -t test/t1 -m "$t1"
mosquitto_pub -h rock-4se -t test/t2 -m "$t2"
sleep 10
doneCheck that the mosquitto-clients package is installed on the ROCK 4SE so data can be published:
$ sudo apt install mosquitto-clientsMake the script executable, then run it – the formatted output is echoed to stdout:
$ chmod +x random-temp.sh
$ ./random-temp.sh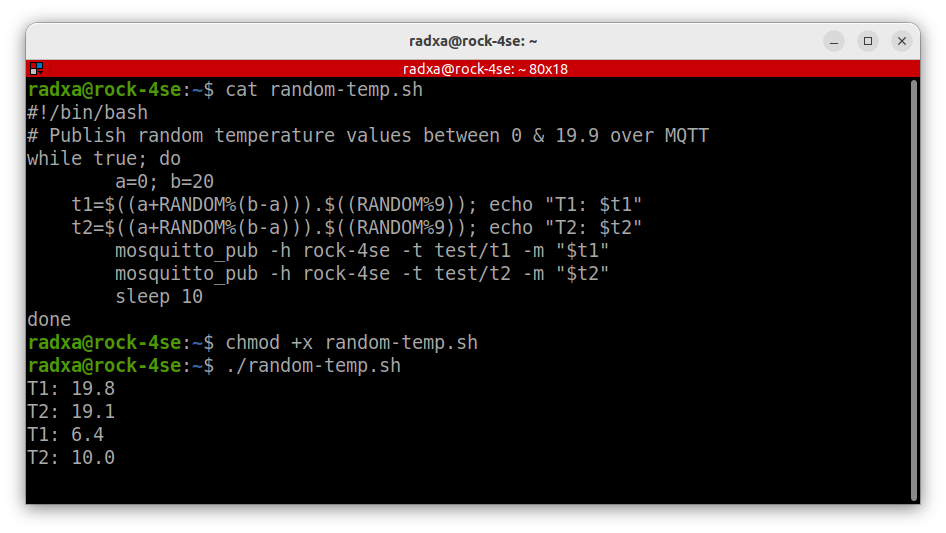
Step 8: Telegraf Config
Now, we can configure Telegraf and its plugins, which is a bit of a dark art, but there are some examples documented on GitHub here.
Also, you can find plugin data formats documented on GitHub here.
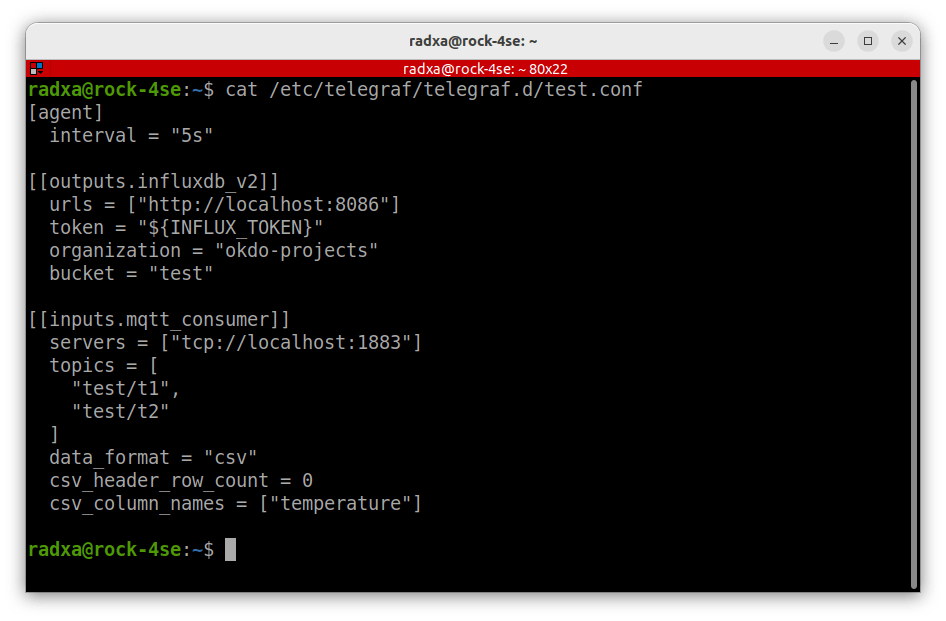
Configuration is made up of plugins, which come with the Telegraf installation. We need an input plugin, which will consume MQTT data and an output plugin that will output the InfluxDB format. We also need to configure the input plugin to accept the CSV payload in the MQTT message we are using in the test script.
Config files should be stored in /etc/telegraf/telegraf.d/ and must have a .config extension.
- Create a config file named conf with the following contents:
$ sudo vi /etc/telegraf/telegraf.d/test.confConfig file…
[agent]
  interval = "5s"

[[outputs.influxdb_v2]]
  urls = ["http://localhost:8086"]
  token = "${INFLUX_TOKEN}"
  organization = "okdo-projects"
  bucket = "test"

[[inputs.mqtt_consumer]]
  servers = ["tcp://localhost:1883"]
  topics = [
    "test/t1",
    "test/t2"
  ]
  data_format = "csv"
  csv_header_row_count = 0
  csv_column_names = ["temperature"]
Here’s how it works:
- Files in /etc/telegraf/telegraf.d/ override any settings in the default config which is in /etc/telegraf/telegraf.conf
- Agent section is overriding the interval setting in the default config file.
- Outputs section is specifying InfluxDB V2 format along with the host URL and port where InfluxDB is running. The access token is for the InfluxDB telegraf user which is read from the environment and the organisation and bucket where we want the data to end up.
- Inputs section defines the MQTT host settings and topics to listen on. It also specifies the CSV data format and the fact that there is no header. Our test data has only a single field, and that is mapped to the name temperature. This will create a label for the values stored in the bucket.
Step 9: Telegraf Token
Before we can run Telegraf, we need to get the InfluxDB telegraf user’s token and make it available to the service unit running telegraf. We also need to configure the service unit itself so that Telegraf starts automatically on boot-up.
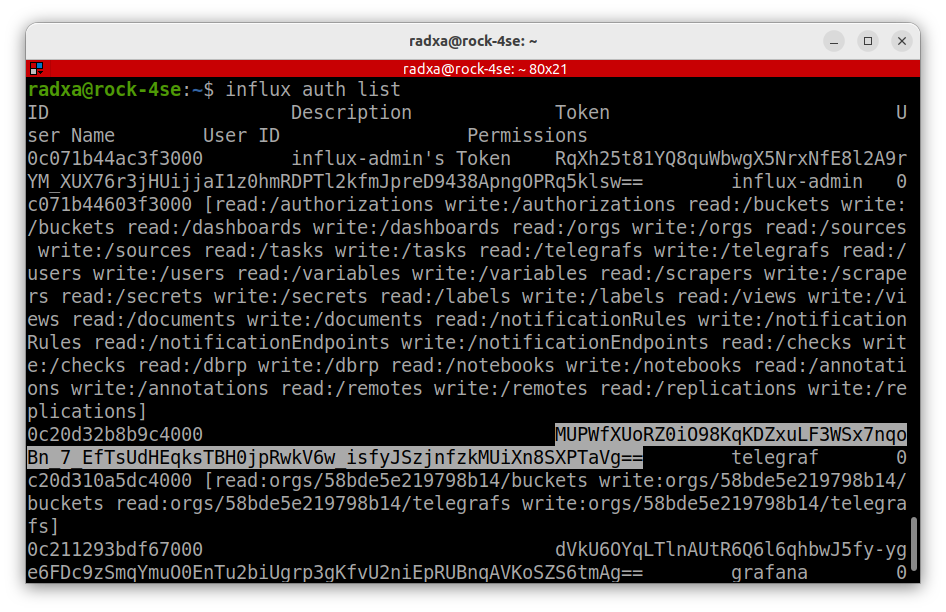
List the InfluxDB authorisations and copy the grafana user’s token:
$ influx auth list
ID			Description		Token				User Name
…
0c20d32b8b9c4000				MUPWfXUoRZ0iO98KqKDZxuLF3WSx7nqoBn_7_EfTsUdHEqksTBH0jpRwkV6w_isfyJSzjnfzkMUiXn8SXPTaVg==	telegraf	0c20d310a5dc4000	[read:orgs/58bde5e219798b14/buckets write:orgs/58bde5e219798b14/buckets read:orgs/58bde5e219798b14/telegrafs write:orgs/58bde5e219798b14/telegrafs]
Create the file /etc/telegraf/telegraf.d/telegraf-token.txt setting the INFLUX_TOKEN environment variable to the telegraf user’s token:
$ sudo vi /etc/telegraf/telegraf.d/telegraf-token.txt
INFLUX_TOKEN="MUPWfXUoRZ0iO98KqKDZxuLF3WSx7nqoBn_7_EfTsUdHEqksTBH0jpRwkV6w_isfyJSzjnfzkMUiXn8SXPTaVg=="
Now, add a new Debian system user, which will run Telegraf, rather than root in the systemd unit. This user doesn’t need a login for added security.
$ sudo useradd -r -s /sbin/nologin telegrafChange ownership of the token file and make it read / write for telegraf only:
$ sudo chown telegraf:telegraf /etc/telegraf/telegraf.d/telegraf-token.txt
$ sudo chmod 600 /etc/telegraf/telegraf.d/telegraf-token.txt
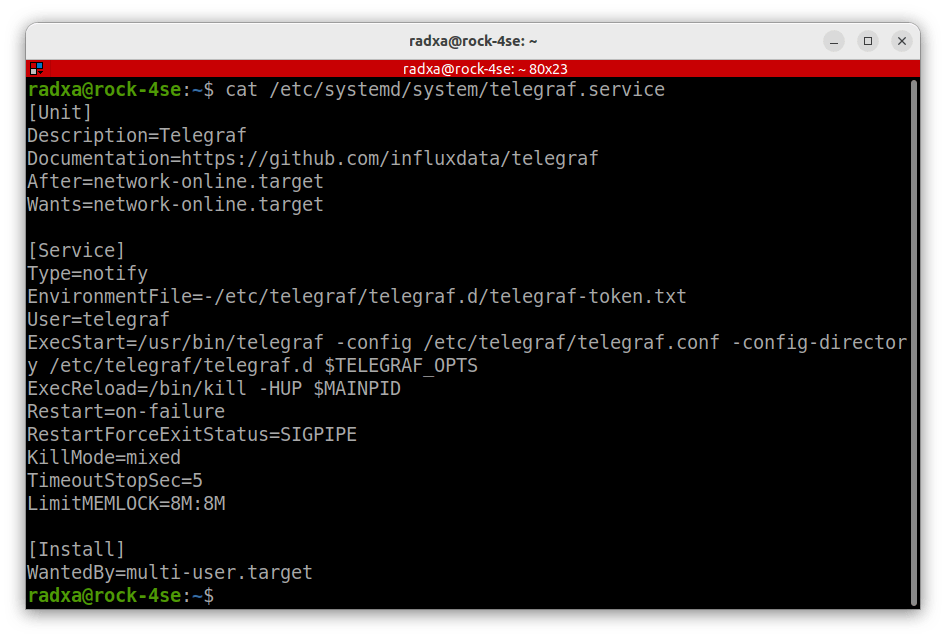
Copy the Telegraf service file so systemd can read it, then edit the EnvironmentFile reference inside it so it points to the telegraf user’s token file we just created:
$ sudo cp /usr/lib/telegraf/scripts/telegraf.service /etc/systemd/system/
$ sudo vi /usr/lib/telegraf/scripts/telegraf.service
Here’s the final contents:
[Unit]
Description=Telegraf
Documentation=https://github.com/influxdata/telegraf
After=network-online.target
Wants=network-online.target
[Service]
Type=notify
EnvironmentFile=-/etc/telegraf/telegraf.d/telegraf-token.txt
User=telegraf
ExecStart=/usr/bin/telegraf -config /etc/telegraf/telegraf.conf -config-directory /etc/telegraf/telegraf.d $TELEGRAF_OPTS
ExecReload=/bin/kill -HUP $MAINPID
Restart=on-failure
RestartForceExitStatus=SIGPIPE
KillMode=mixed
TimeoutStopSec=5
LimitMEMLOCK=8M:8M
[Install]
WantedBy=multi-user.target
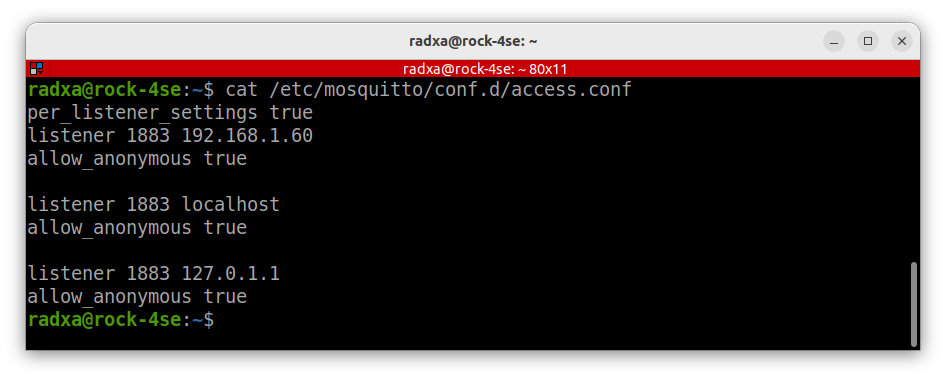
Make sure your MQTT broker is running and allowing anonymous access on port 127.0.1.1:1883. This is insecure and will need tightening up when you have finished testing. Here’s the full guide to setting up the MQTT gateway.
These are the access settings on our test broker:
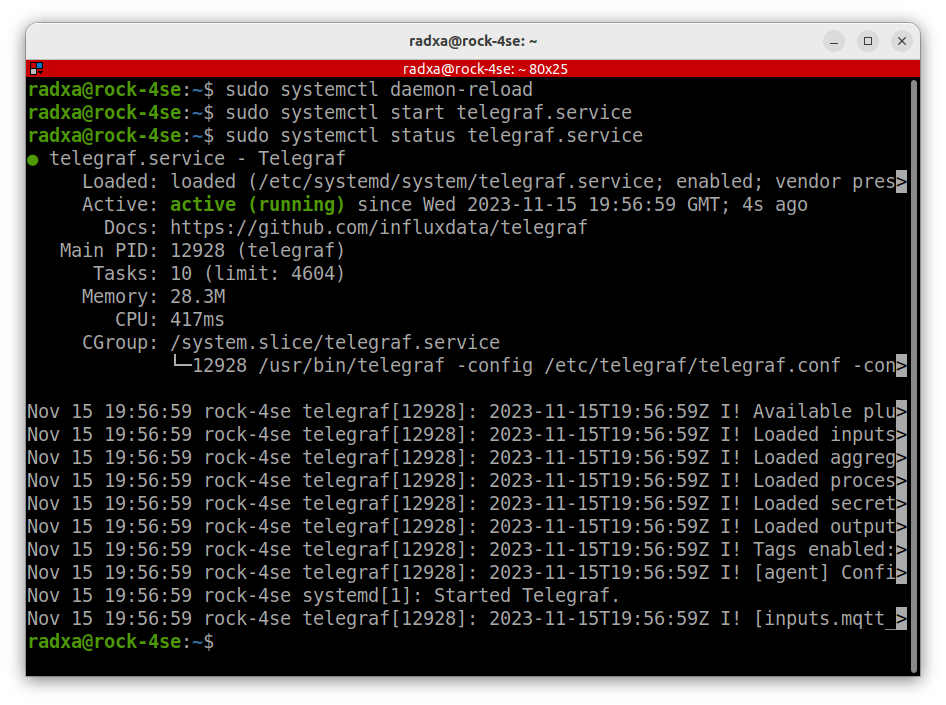
Now we should be able to start up the Telegraf service and check that it’s running as expected – any issues will show up here:
$ sudo systemctl daemon-reload
$ sudo systemctl start telegraf.service
$ sudo systemctl status telegraf.service
Step 10: InfluxDB Testing
Let’s do a quick check to see if we are receiving data into InfluxDB.
Assuming your MQTT broker is running along with InfluxDB, Telegraf and the mock test script in a Terminal on the ROCK 4SE, run the following commands using Influx CLI:
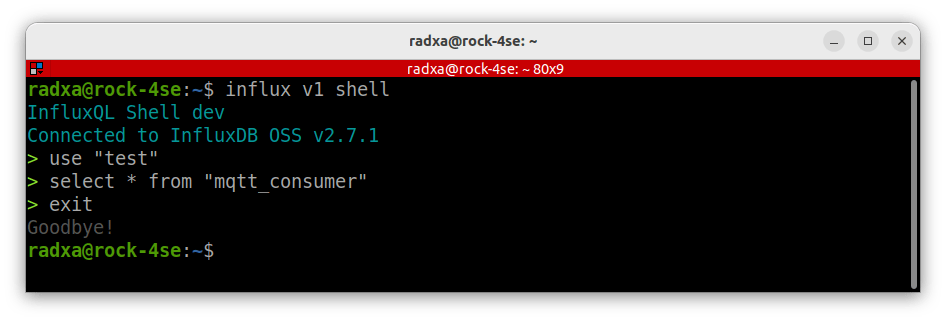
When the shell opens, set the name of the bucket at the prompt and press return, then add the select query and return. You should then see the results of the query. Press q to return to the prompt, then type exit to end the session:
$ influx v1 shell
> use "test"
> select * from "mqtt_consumer"
> exit
The session should look like this after exiting:
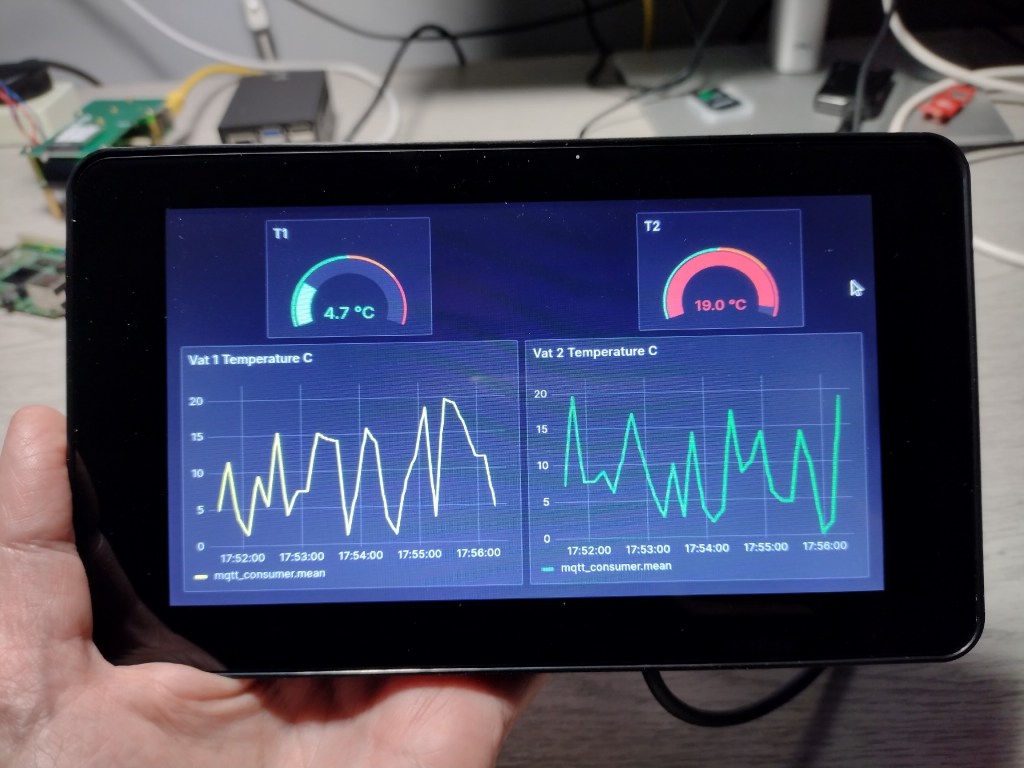
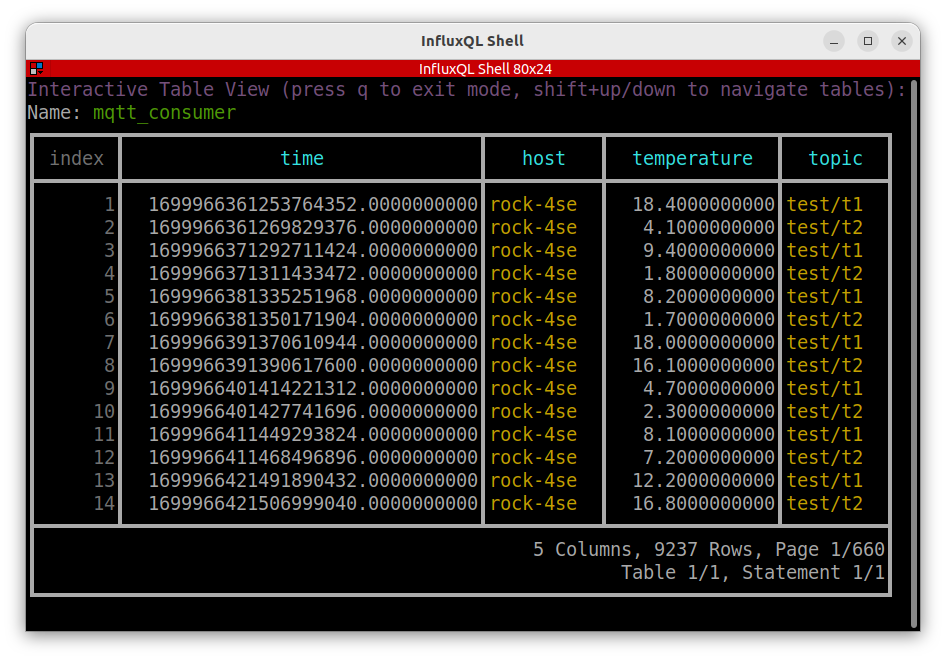
The query results for the test bucket should look something like this, where you can see the temperature column name added by Telegraf and the timestamp added by InfluxDB to the values sent over MQTT:
Congratulations if you’ve got this working! So now you are able to collect any kind of data that is being published to your MQTT server and store it away in InfluxDB.
In the next steps, we show how to use that stored data for analysis and display so that it becomes useful.
Step 11: Grafana
Now, we will turn our attention to the ROCK 3A which will host Grafana OSS which is a versatile Open Source display and analytics application. It’s relatively easy to create fancy dashboard displays full of useful analytics in a browser based terminal. It’s also very well documented and supported by online video tutorials.
In our example, Grafana will source its data from InfluxDB running on the ROCK 4SE and display the sensor data as both its current value and as a time series. We will automate the software so that it displays on the attached Touch Screen display on bootup.
The dashboard can also be viewed by other hosts on the network using browser access.
Install Grafana by visiting the downloads page to obtain the URL for the latest version of Grafana for Debian on Arm64.
The instructions are on the page, but here they are:
$ sudo apt-get install -y adduser libfontconfig1 musl
$ wget https://dl.grafana.com/oss/release/grafana_10.1.5_arm64.deb
$ sudo dpkg -i grafana_10.1.5_arm64.deb
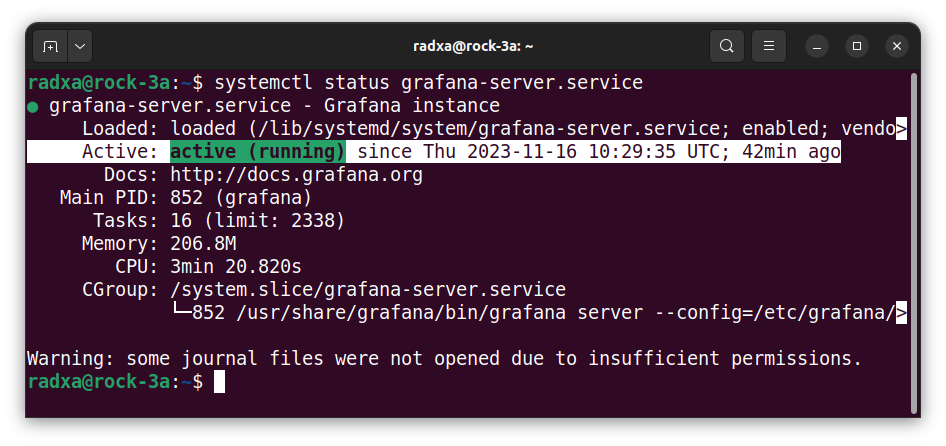
Enable Grafana, start up the service, and then check it’s running:
$ sudo systemctl daemon-reload
$ sudo systemctl enable grafana-server.service
$ sudo systemctl start grafana-server.service
$ systemctl status grafana-server.service
Step 12: Grafana Config
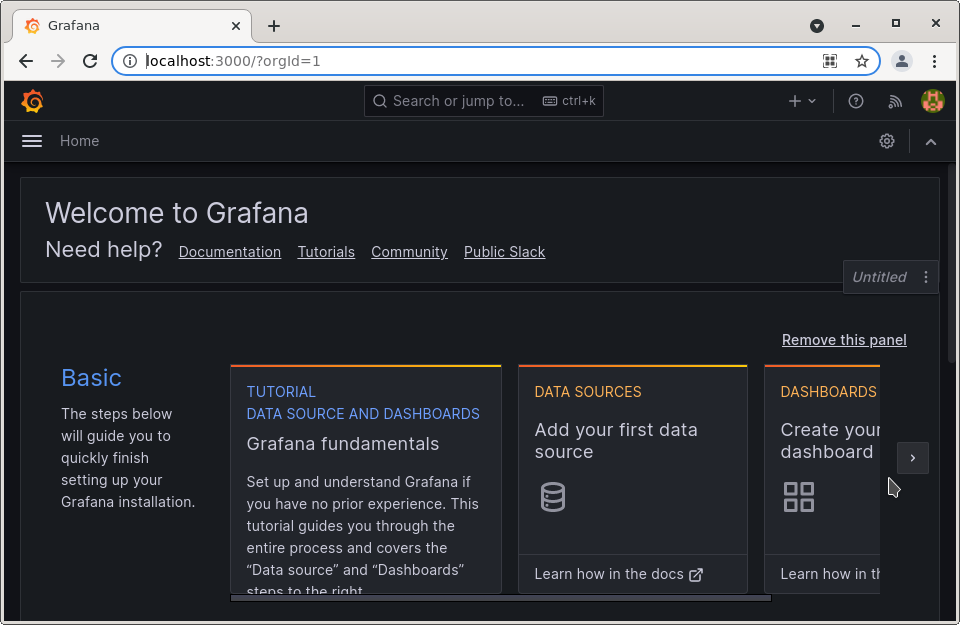
Grafana runs as a web interface, so open the following URL in your host’s browser, and log in with admin / admin then change the password.
Note: If the hostname is not found, use the ROCK 3As IP address instead.
You will be redirected to the Grafana welcome screen where you can add a data source:
As you might expect, a Grafana Data Source defines where the data to be used is sourced from. It also handles any authorization to that source, which in our case will be InfluxDB running on the ROCK 4SE, using our grafana user’s token.
If the setup is successful, the same Data Source can be used across many different Dashboards.
Click Data Sources and add an InfluxDB datasource. Then, fill out the top of the form like this:
- Set the name of the Data Source – we called ours InfluxDB-test
- Set the Query Language to InfluxQL and the URL of the InfluxDB, ours is http://192.168.1.60:8086
Leave all the other settings as defaults. Here’s a screenshot of the top part of the form:
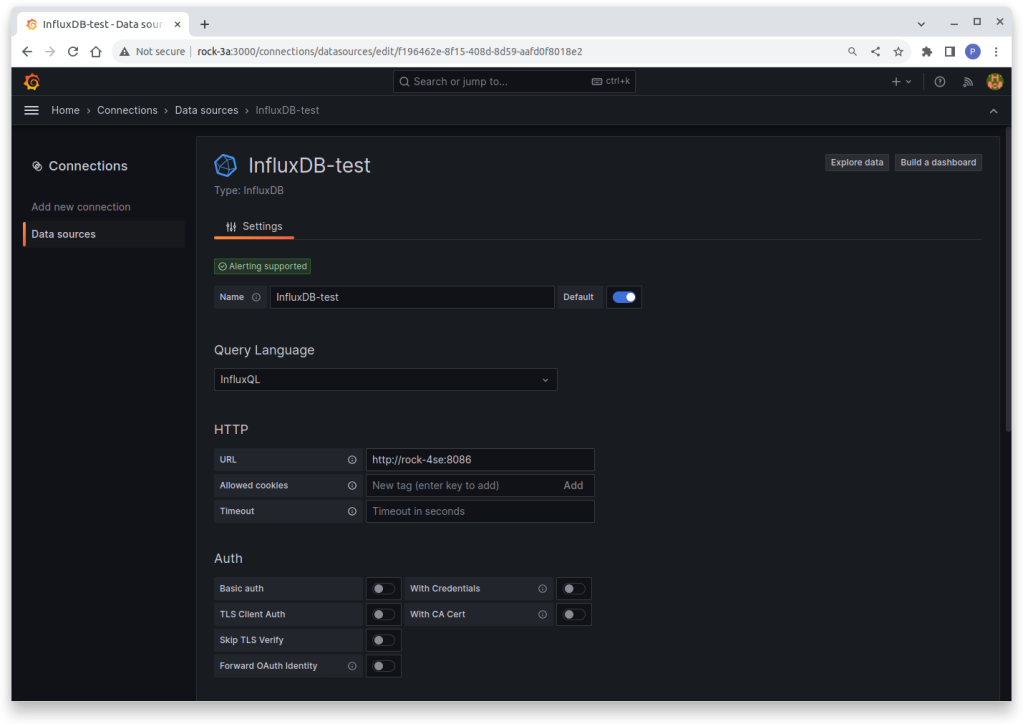
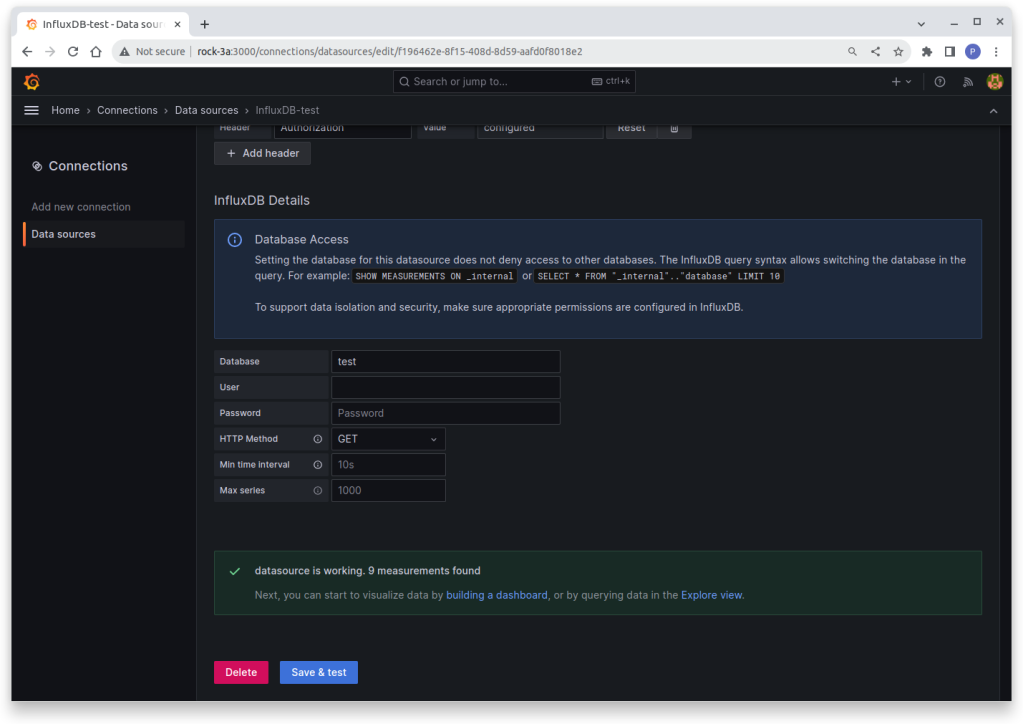
Fill out the bottom of the form like this:
- Click the Add header button, and in the Header field, enter Authorization.
- In the Value field, enter Token, then a space followed by the InfluxDB grafana user’s token like this (all on one line):
Token dVkU6OYqLTlnAUtR6Q6l6qhbwJ5fy-yge6FDc9zSmqYmuO0EnTu2biUgrp3gKfvU2niEpRUBnqAVKoSZS6tmAg==Note: Get the token by running this command on the ROCK 4SE:
$ influx auth list- Set the database name to test (the bucket name in this case) and the HTTP method to GET.
There’s no need for a user and password as the token does the authorisation. When you press the Save & Test button, you should get the green tick to say everything is working.
If you have any issues, access this documentation about using Grafana with InfluxDB.
Step 13: Dashboards
Once a Datasource is defined, you can go on to create some fancy dashboards.
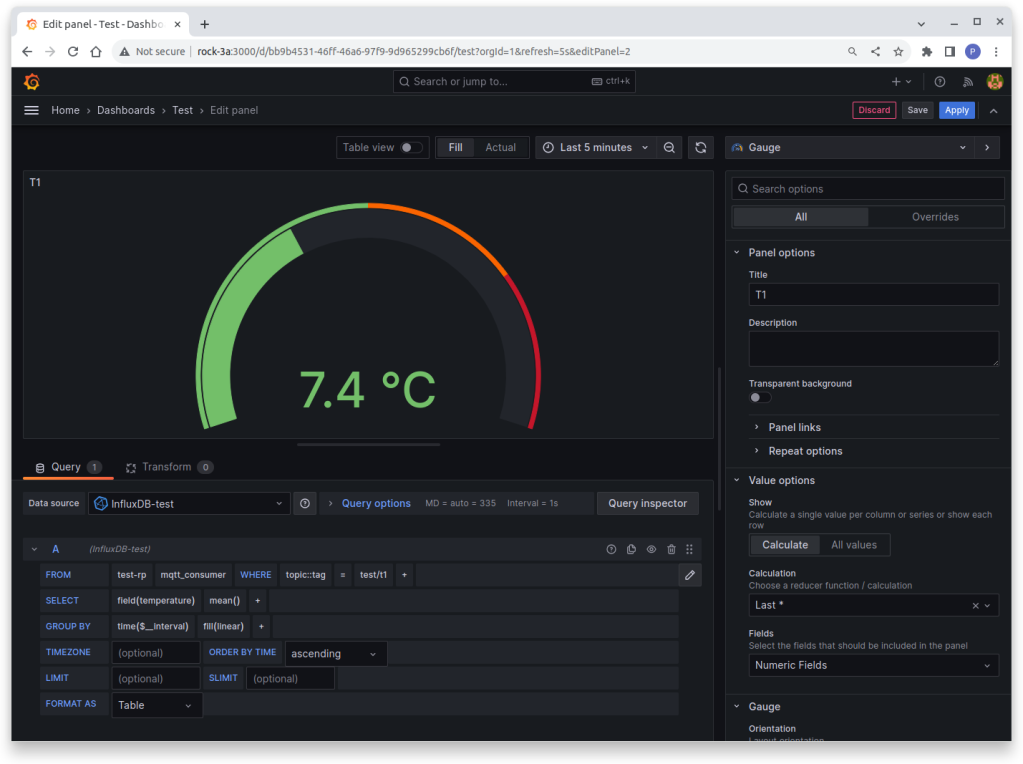
- From the Burger Menu, select Dashboards and create a Gauge
In the Query Inspector tab:
- Set InfluxDB-test as the datasource.
- Set the query to read (test-rp is the mapped bucket name this time, which is a bit confusing):
FROM test-rp mqtt_consumer WHER Topic::tag = test/t1
SELECT field(temperature) mean()
GROUP BY time($_interval) fill(linear)
- Leave all the other settings as Defaults.
- In the Properties section in the Right Hand panel, set up the Gauge to your liking by experimenting with the settings.
- Click apply to save the changes.
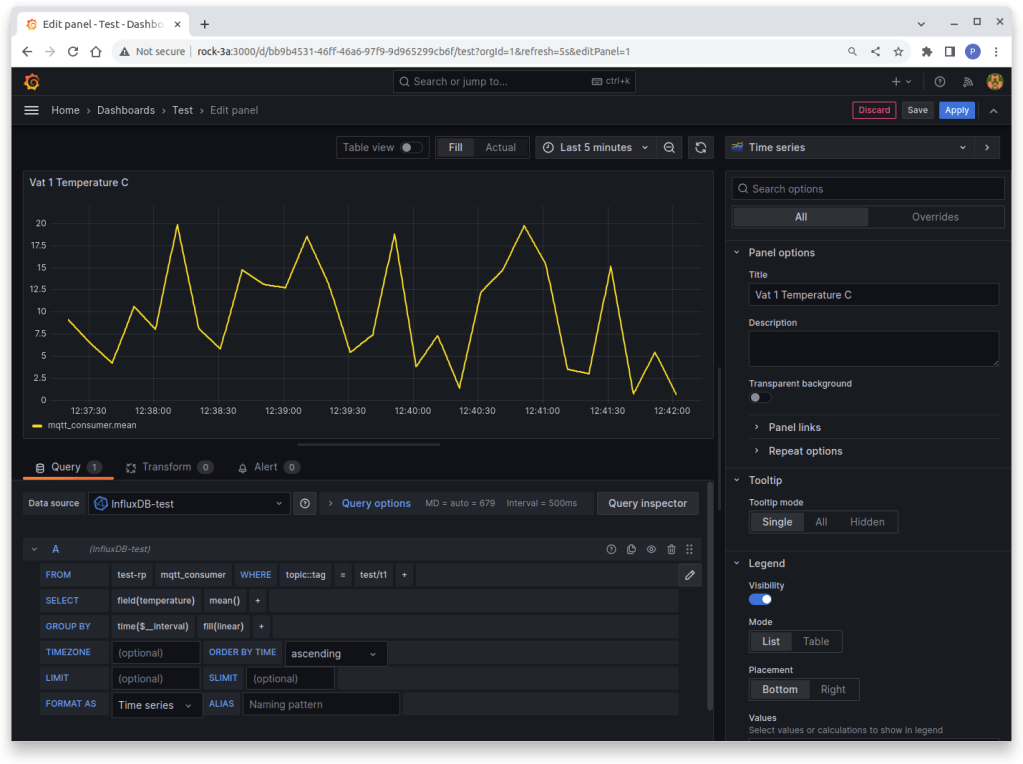
You can do a similar thing for a Time Series display. Use the same query settings as above for FROM, SELECT and GROUP BY. Again, experiment with the Properties area to achieve the desired look.
Step 14: Automation
Once all the display elements are in place and the dashboard laid out, attach a keyboard and mouse to the ROCK 3A, log in and fire up the browser on the screen and log in to Grafana.
http://localhost:3000
You may need to adjust the Dashboard a bit to get it to display properly on this smaller screen.
If you want to display on the ROCK 3A to automatically show the Grafana dashboard on boot up there are a few tricks that can be used to do that.
First of all, set up auto login in the display manager for the radxa user so that the desktop loads on bootup without having to log in:
$ sudo vi /etc/lightdm/lightdm.confEdit this line so it references the radxa user:
autologin-user=radxaNow, setup a desktop file ~/.config/autoconfig/chromium.desktop for the radxa user with the following contents. It executes a bash script when the desktop loads:
$ vi ~/.config/autostart/chromium.desktop
[Desktop Entry]
Encoding=UTF-8
Version=0.9.4
Type=Application
Name=Chromium
Exec=/home/radxa/start.sh
TryExec=/home/radxa/start.sh
Create the bash script to load Chromium in kiosk mode – there needs to be a delay to allow the Grafana service to start first:
$ vi start.sh
#!/bin/bash
sleep 20
/usr/bin/chromium localhost:3000 --kiosk
Finally make it executable:
$ chmod +x start.shNow reboot. The first time Grafana starts, you will need to log in with the Grafana username and password, but once you have done this, the next time you restart the device, it will log in automatically so you can remove the keyboard.
Use the Power button on the ROCK 3A to shut it down safely and restart it. 🙂
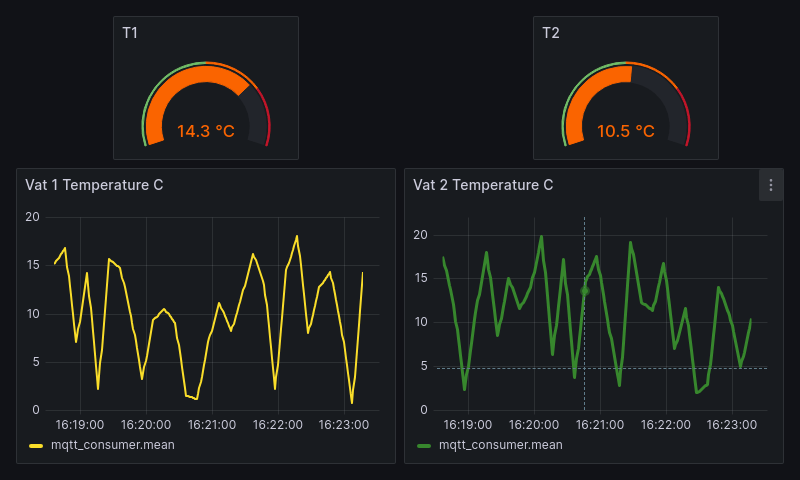
Here’s a Dashboard I made earlier running on the ROCK 3A with the 7 inch Raspberry Pi Touch Screen:
Step 15: Troubleshooting
There are a lot of moving parts in this project so it’s easy for a step to go wrong.
- Make sure each of the services is actually running by checking its status in systemd. On the ROCK 4SE, you should have Mosquitto, InfluxDB and Telegraf all running, plus the mock data script.
On the ROCK 3A, you should have Garafana running.
You can check, for example, that InfluxDB is running with:
$ systemctl status influxd.service- Check that InfluxDB is actually receiving data into the bucket by repeating the test in Step 10: InfluxDB Testing.
- Check you are using the correct InfluxDB Tokens and that they have sufficient access rights. You can delete tokens and create new ones – see the InfluxDB documentation.
In our setup, the telegraf user’s token is stored in the file /etc/telegraf/telegraf.d/telegraf-token.txt to configure the environment variable INFLUX_TOKEN for the telegraf.service unit.
To configure the Grafana Data Source, we used the InfluxDB grafana user’s token. This must be entered in the setup form in the format:
Token xxxxxxxxxxxxxxxxxxxxxxxxxxxxxxxxxxxxxxxxxx
Tokens can be viewed on the host using the Influx CLI with:
$ influx auth list- Check the directory and file permissions of configuration files and directories to make sure the relevant user has access rights.
5. Check the logs in
/var/log/<app_name>- Search online with any error message to see if there are solutions.
Summary
In this project, we have shown how to capture sensor data over MQTT protocol from remote devices on the IoT network and store the information in a centralised database using InfluxDB and Telegraf.
With these two Open Source applications, it should be possible to handle many sensor capture scenarios from multiple distributed devices, which can scale according to needs, all running on low power ROCK servers.
We then showed how to use the information as a data source for Grafana dashboards for analytic and display purposes. The example automated a dashboard display using a ROCK 3A in conjunction with a Touch Screen.
References
- InfluxDB
- Telegraf
- Grafana OSS
- Build a secure Mosquitto MQTT gateway
- Adding NVMe SSDs to ROCK boards
- Adding Raspberry Pi 7 inch Display to ROCK boards
![]()


Let’s invent the future together
What’s your challenge? From augmented reality to machine learning and automation, send us your questions, problems or ideas… We have the solution to help you design the world. Get in touch today.
Looking for something else? Discover our Blogs, Getting Started Guides and Projects for more inspiration!
Like what you read? Why not show your appreciation by giving some love.
From a quick tap to smashing that love button and show how much you enjoyed this project.

