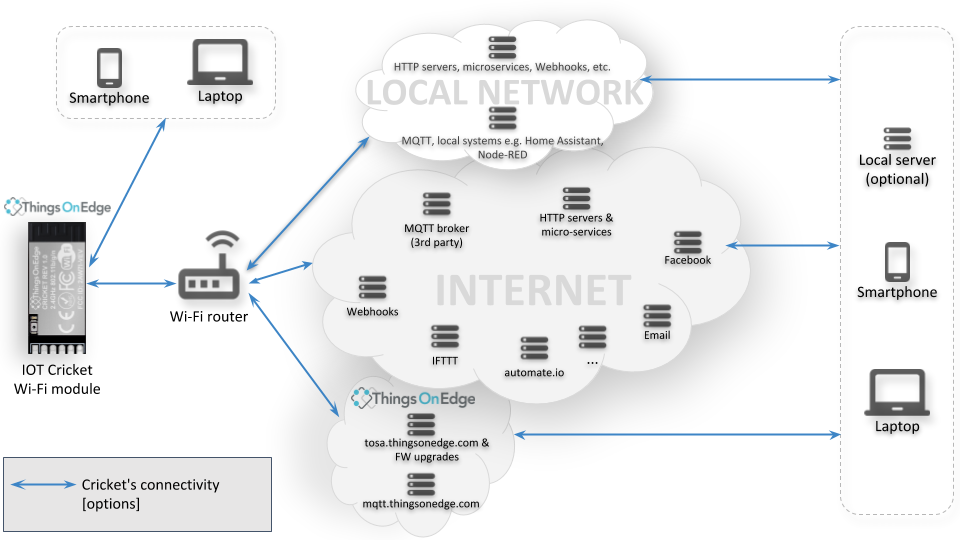
Cricket is a tiny low power IoT module from ThingsOnEdge. It’s capable of connecting to most local or cloud-based IoT services and runs on batteries for thousands of hours.
In this project, you’ll learn how to connect Cricket modules to a local network using Wifi with MQTT. You will store readings from the Cricket’s onboard temperature sensor using InfluxDB with Telegraf and display the results in a Grafana dashboard. All these components are open-source and can be hosted on a Raspberry Pi.
At the end of the project, you will have a powerful and extendable IoT platform that can be used to monitor a network of Cricket modules in any space with Wifi access.
1. Raspberry Pi server
The Raspberry Pi will host all of the software components that enable Cricket to publish MQTT messages and display that information as graphs and gauges in a dashboard. The Raspberry Pi will act as a server on the local network which we will access from a host PC (Windows 10 / Mac OS / Linux) using OpenSSH.
- Flash the latest version of Raspberry Pi OS Lite to a 16GB SD card. Full details of how to do this are available on the Raspberry Pi download page.
- After flashing has completed, remove the SD card from the PC card reader and re-insert it.
- Create an empty file named ssh in the boot drive of the SD card using a file manager. The filename must have no extension.
- Eject the SD card from the host PC and insert into the Raspberry Pi.
- Connect the Raspberry Pi to your network using Ethernet and power it on.
- Open a command window (Terminal) on your host PC.
- Log in using ssh:
ssh pi@raspberrypi- Use the default username pi and password raspberry.
If the Raspberry Pi hostname is not resolved try using ssh pi@raspberrypi.local or check your router’s admin page and use the Pi’s IP address – ssh pi@XXX.XXX.XXX.XXX
2. Install software
Now all the required software can be installed. Several packages are needed to connect everything together. Mosquitto MQTT broker acts as a queue for messages published by the Cricket. Telegraf server agent connects the MQTT broker to the InfluxDB database while Grafana will present the stored data as a dashboard.
- Update the Raspberry Pi OS:
sudo apt update
sudo apt upgrade- Install Mosquitto broker and client:
sudo apt-get install mosquitto mosquitto-clients- Add the InfluxData repository:
sudo apt install apt-transport-https
wget -qO - https://repos.influxdata.com/influxdb.key | sudo apt-key add -
source /etc/os-release
test $VERSION_ID = "10" && echo "deb https://repos.influxdata.com/debian buster stable" | sudo tee /etc/apt/sources.list.d/influxdb.list- Install the Telegraf service:
sudo apt update && sudo apt install telegraf- Install InfluxDB database
sudo apt install influxdb- Add Grafana’s repository:
wget -qO - https://packages.grafana.com/gpg.key | sudo apt-key add -
echo "deb https://packages.grafana.com/oss/deb stable main" | sudo tee /etc/apt/sources.list.d/grafana.list- Install Grafana:
sudo apt update && sudo apt install grafana- Finally, re-boot the Raspberry Pi and log back in via ssh:
sudo reboot
3. Cricket
Cricket modules are designed for battery power and consume only 0.5uA in deep sleep, so can run for thousands of hours on one pair of AA batteries, depending on setup.
Each module has an accurate onboard temperature sensor and a battery monitor. There is 3.3V power output, digital and analogue inputs and an external wake-up pin for additional sensors. Configuration can be set locally via the Cricket’s own Wireless AP or using a free Cloud-based option provided by ThingsOnEdge. No coding is required to send data from the module.
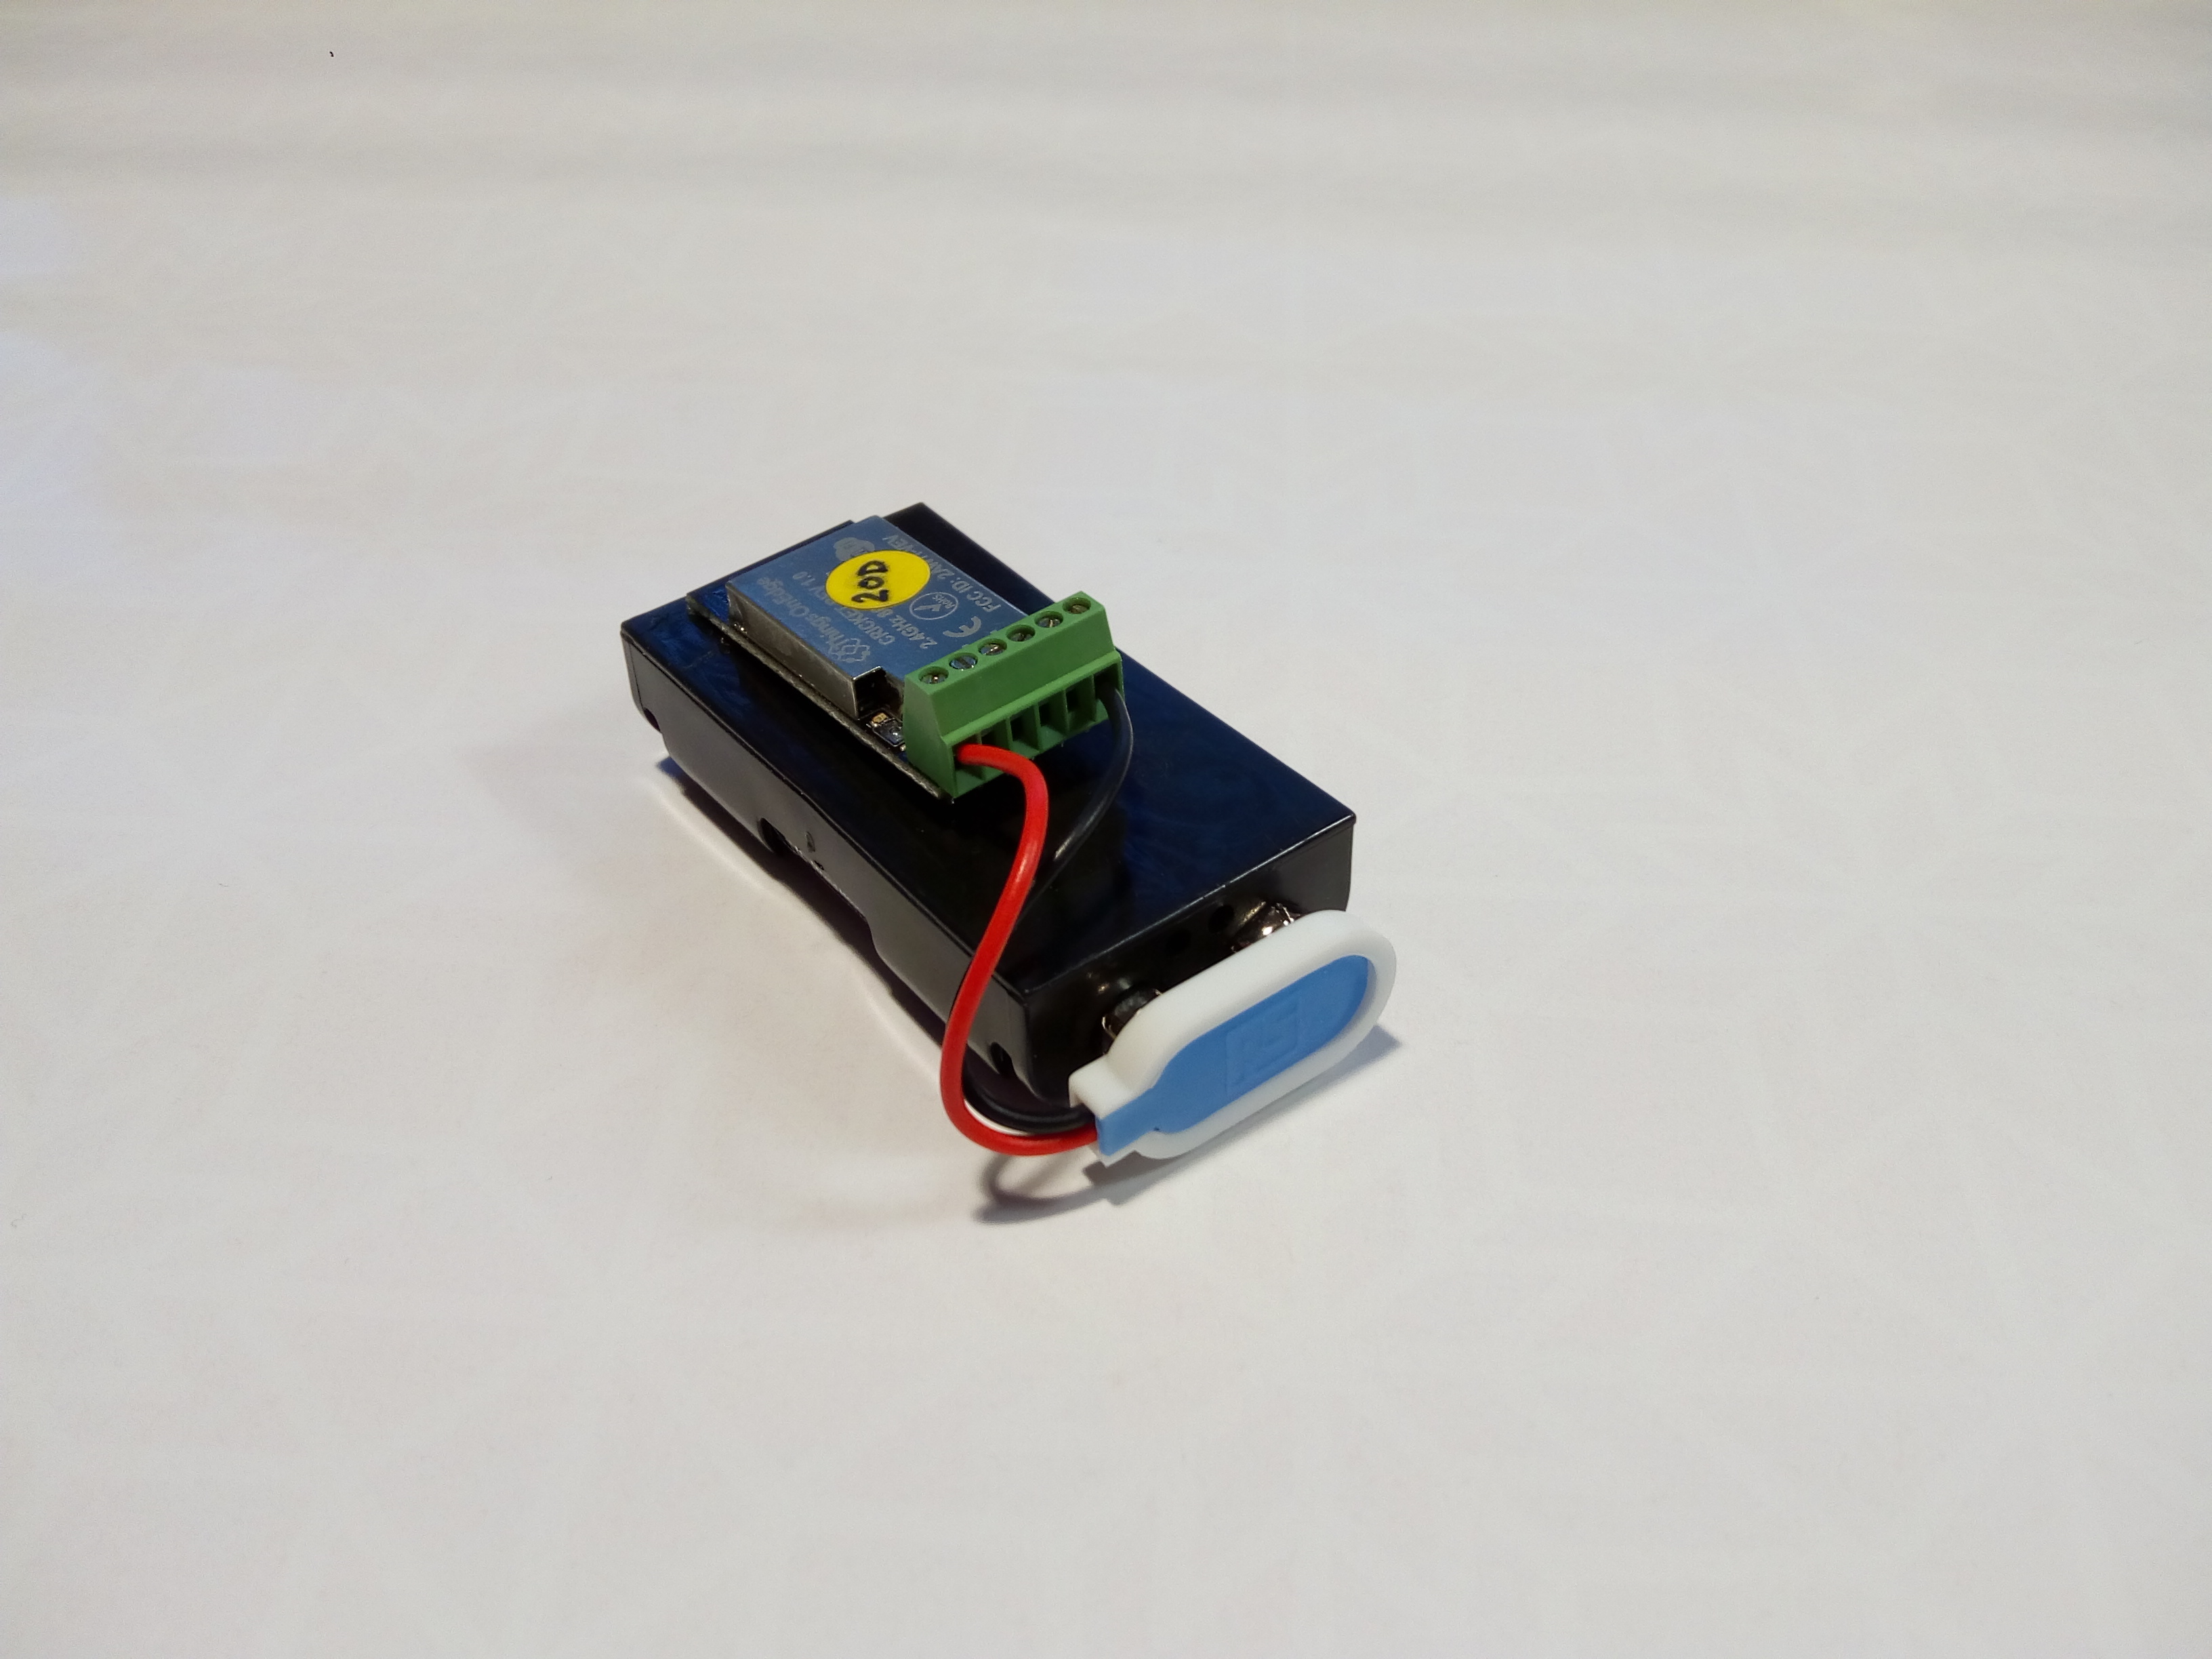
We will power the Cricket using 2 x AA batteries and configure it using the local AP mode.
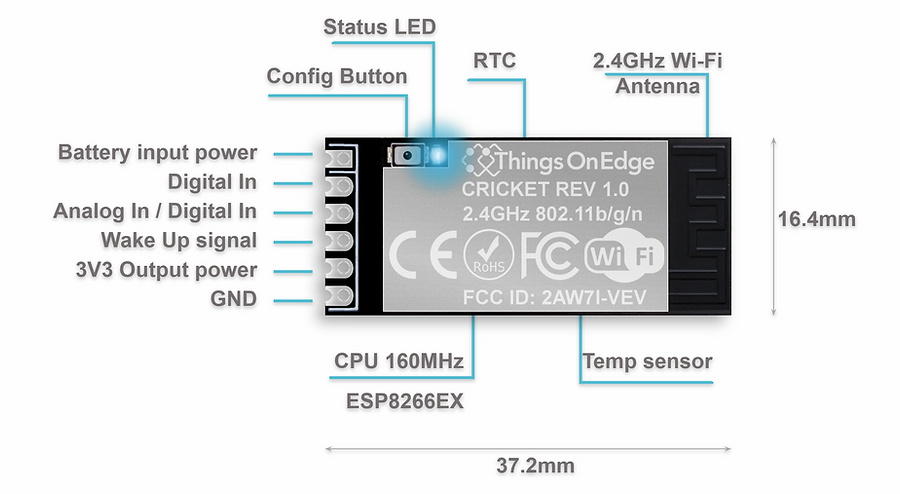
Crickets have 6 castellated through-hole solder pads at 2.54mm spacing, suitable for various connectors or soldering to PCB’s.
- Solder a terminal block connector to the Cricket.
- Attach the positive lead of the battery connector to the Battery (BATT) connector and the negative lead to the Ground (GND) connection.
- Insert 2 x AA batteries into the battery holder.
Several configuration options allow Cricket to communicate with most local and cloud-based IoT services, using HTTP or MQTT protocol.
For testing we will setup Cricket to send readings from its onboard temperature sensor every 20 sec using MQTT.
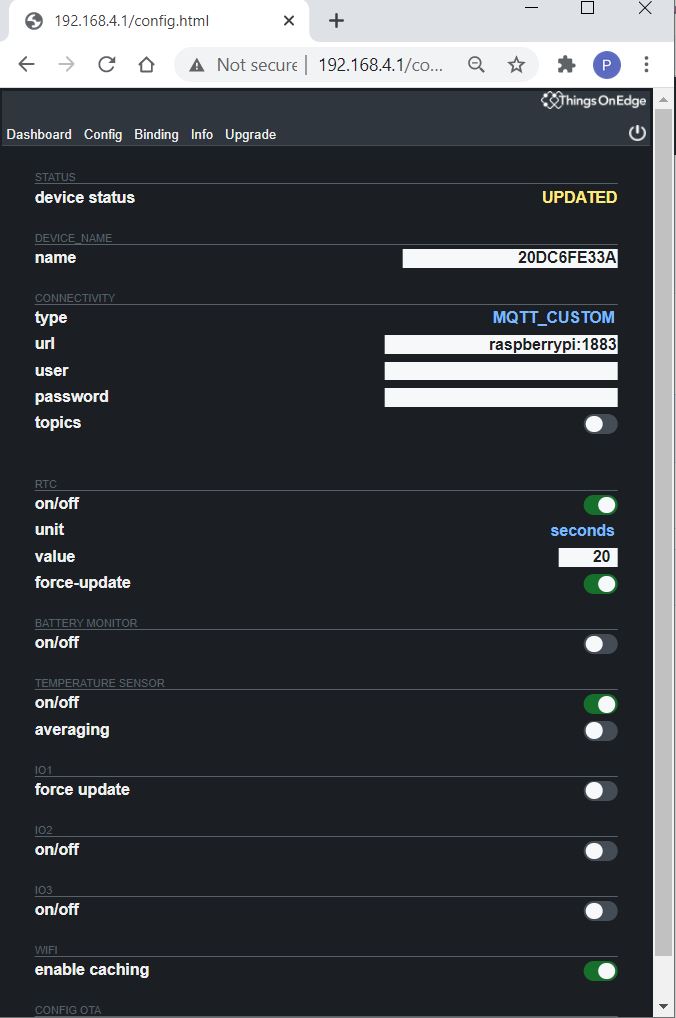
- Press and hold down the config button for about 5 sec until the blue LED starts blinking 4 times per second. The device is now in Binding Mode.
- Open the Wifi settings on your PC and connect to the toe_device Wifi AP.
- After a few seconds, your browser will open in the Binding option – if not go to address http://192.168.4.1
- Select your network SSID from the list of available AP’s.
- Enter your network Wifi key and wait for the module to connect.
- Select the Config option.
- Select connection type MQTT_CUSTOM
- Enter the Raspberry Pi hostname and MQTT port number (separated by : )
- Set real time clock (RTC) to ON
- Set time to Seconds and value 20
- Set Force-update ON
- Set Temperature sensor ON
- Set Wifi caching ON
- All other settings should be OFF
This example uses a Raspberry Pi hostname raspberrypi and MQTT broker port 1883.
- Select the Info option.
- Note down the Serial Number and Password.
- Click the power button icon on the top right of the screen to restart the Cricket with the new configuration.
Cricket is now configured and will restart. The LED will flash a few times as it connects to Wifi and attempts to sends data via MQTT. Now every 20 sec the real-time clock will wake the module, the LED will flash and the current temperature in degrees Celsius will be sent, then it will turn off until the next update.
4. MQTT
This step tests the Mosquitto broker and checks that Cricket is able to send MQTT messages successfully.
Mosquitto starts automatically on boot-up and listens on default port 1883. Check the status with the following command:
systemctl status mosquitto.service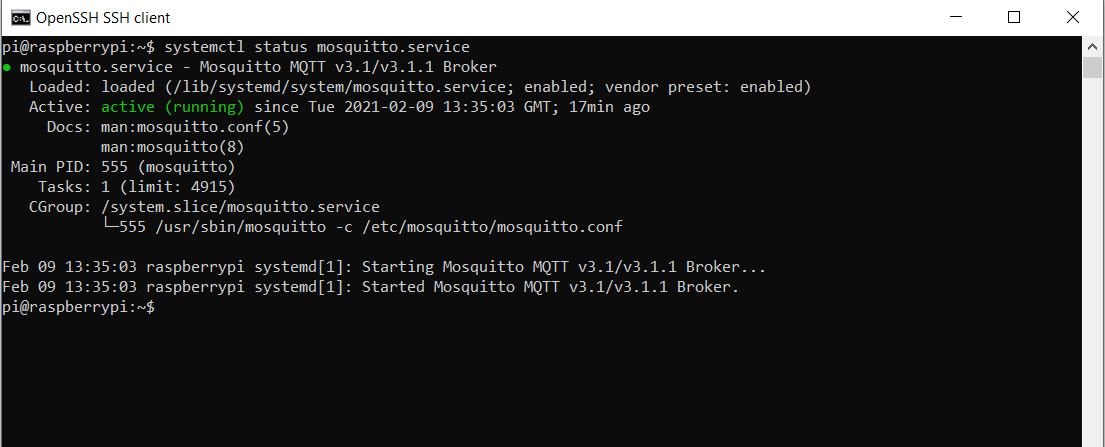
The service can be started with the following command if it isn’t running:
sudo systemctl start mosquitto.serviceMosquitto listens for devices publishing MQTT messages and holds them in a queue called the Topic path. By default, Cricket publishes temperature readings to topic path /<your-device-serial-number>/temp.
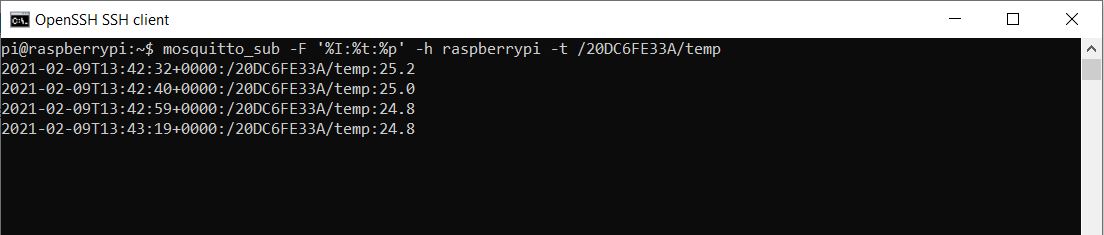
Our Cricket’s serial number is 20DC6FE33A so it publishes temperature readings on topic /20DC6FE33A/temp – the slash characters are significant!
Clients can subscribe to topics and receive messages each time they are published:
- Test with the Mosquitto client by subscribing to the temperature topic and formatting the timestamp as ISO-8601 so you can read it.
mosquitto_sub -F '%I:%t:%p' -h raspberrypi -t /20DC6FE33A/temp
You should see temperature readings being updated about every 20 seconds showing the Cricket is connecting and the broker is working. Temperature readings are over-stated when polled this quickly due to heating of the PCB. This will be corrected later on.
5. InfluxDB
Now InfluxDB can be configured so we have a database to store our temperature readings.
- Check that the InfluxDB service is running:
systemctl status influxdb.service-
If not start it:
systemctl status influxdb.service- Start the influx client, create a database for the readings and add a separate admin user so Grafana will be able to access the data:
influx
create database cricket
use cricket
create user grafana with password 'jg99ifF&kln' with all privileges
grant all privileges on cricket to grafana
exit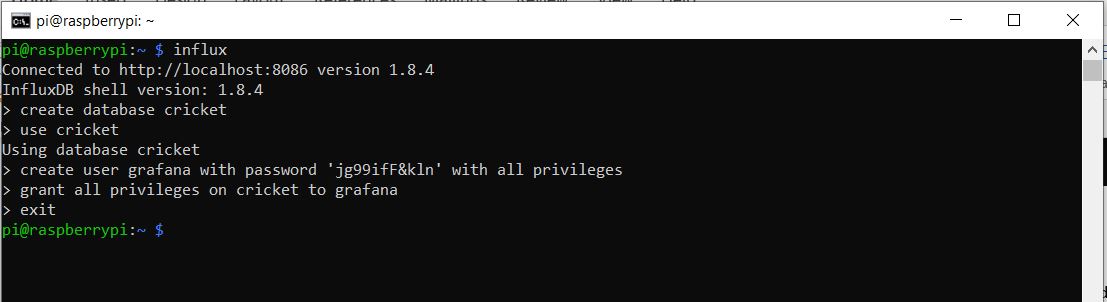
6. Telegraph
Telegraf uses plug-ins to support many different data inputs and outputs. We will use the MQTT Consumer input plug-in and the InfluxDB output plug-in to connect the Mosquitto broker to the InfluxDB database so messages will be saved each time they are published.
- Create a default configuration file telegraf.conf in /etc/telegraf/.
cd /etc/telegraf
sudo sh -c 'telegraf config > telegraf.conf'
Plug-ins should be configured in /etc/telegraf/telegraf.d/ with a filename ending in .conf
- Change directory:
cd /etc/telegraf/telegraf.d/- Create a file named cricket.conf with the following contents. You will need sudo privileges:
[[inputs.mqtt_consumer]]
  # MQTT broker
  servers = ["tcp://localhost:1883"]
  topics = ["/20DC6FE33A/temp"]
  qos = 0
  connection_timeout = "30s"
  data_format = "value"
  data_type = "float"

[[outputs.influxdb]]
  # InfluxDB instance
  url = "http://localhost:8086"
database = "cricket"- Restart Telegraf:
sudo systemctl restart telegraf.service- Check Influx is storing the temperature readings:
influx
use cricket
select * from mqtt_consumer
exit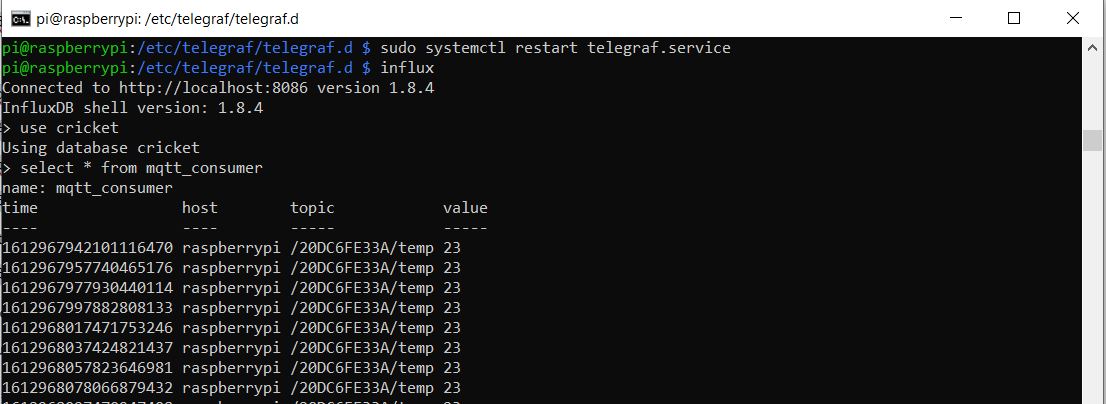
7. Grafana
Now that temperature readings are being saved in InfluxDB, we can connect up Grafana and build a dashboard to present the data in a useful way.
- Enable Grafana, start up the service, then check it’s running:
sudo systemctl enable grafana-server.service

sudo systemctl start grafana-server.service

systemctl status grafana-server.service- Open a browser and go to http://raspberrypi:3000
- Login with username admin and password admin and reset the admin password.
You will now be redirected to the Grafana welcome screen:
Add a data source:
- Click Data Sources.
- Add an InfluxDB datasource.
- Set the url to http://localhost:8086
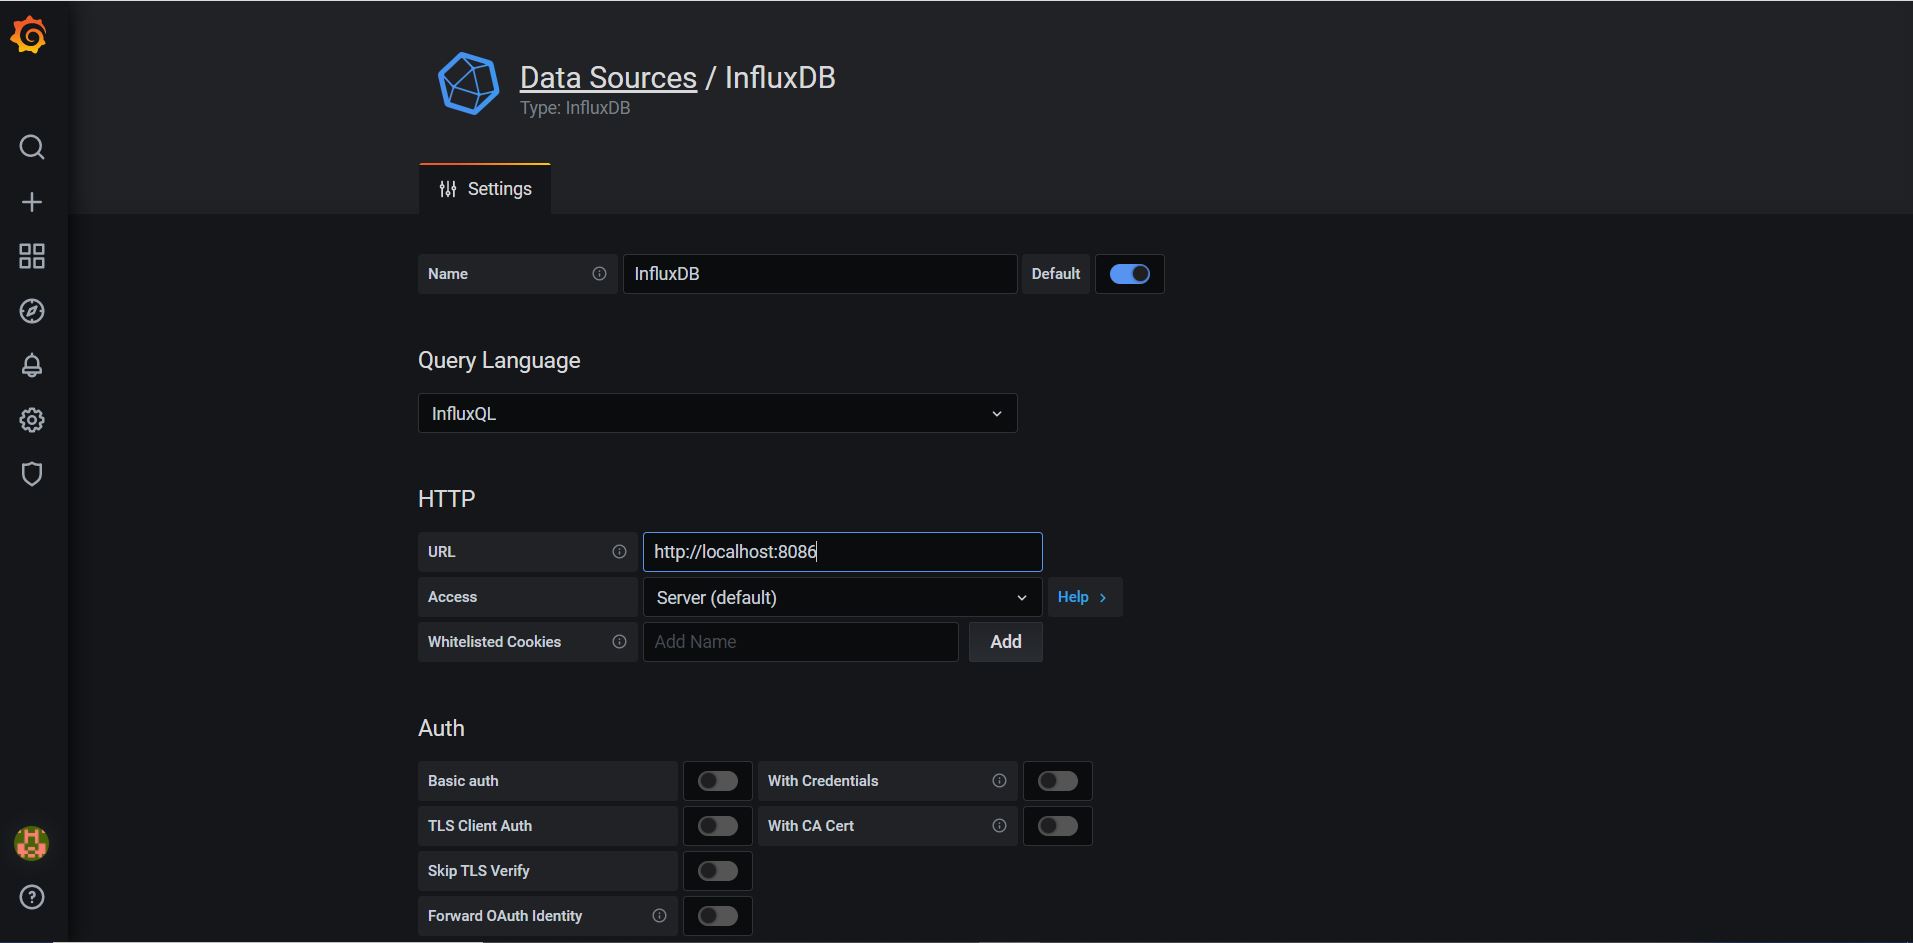
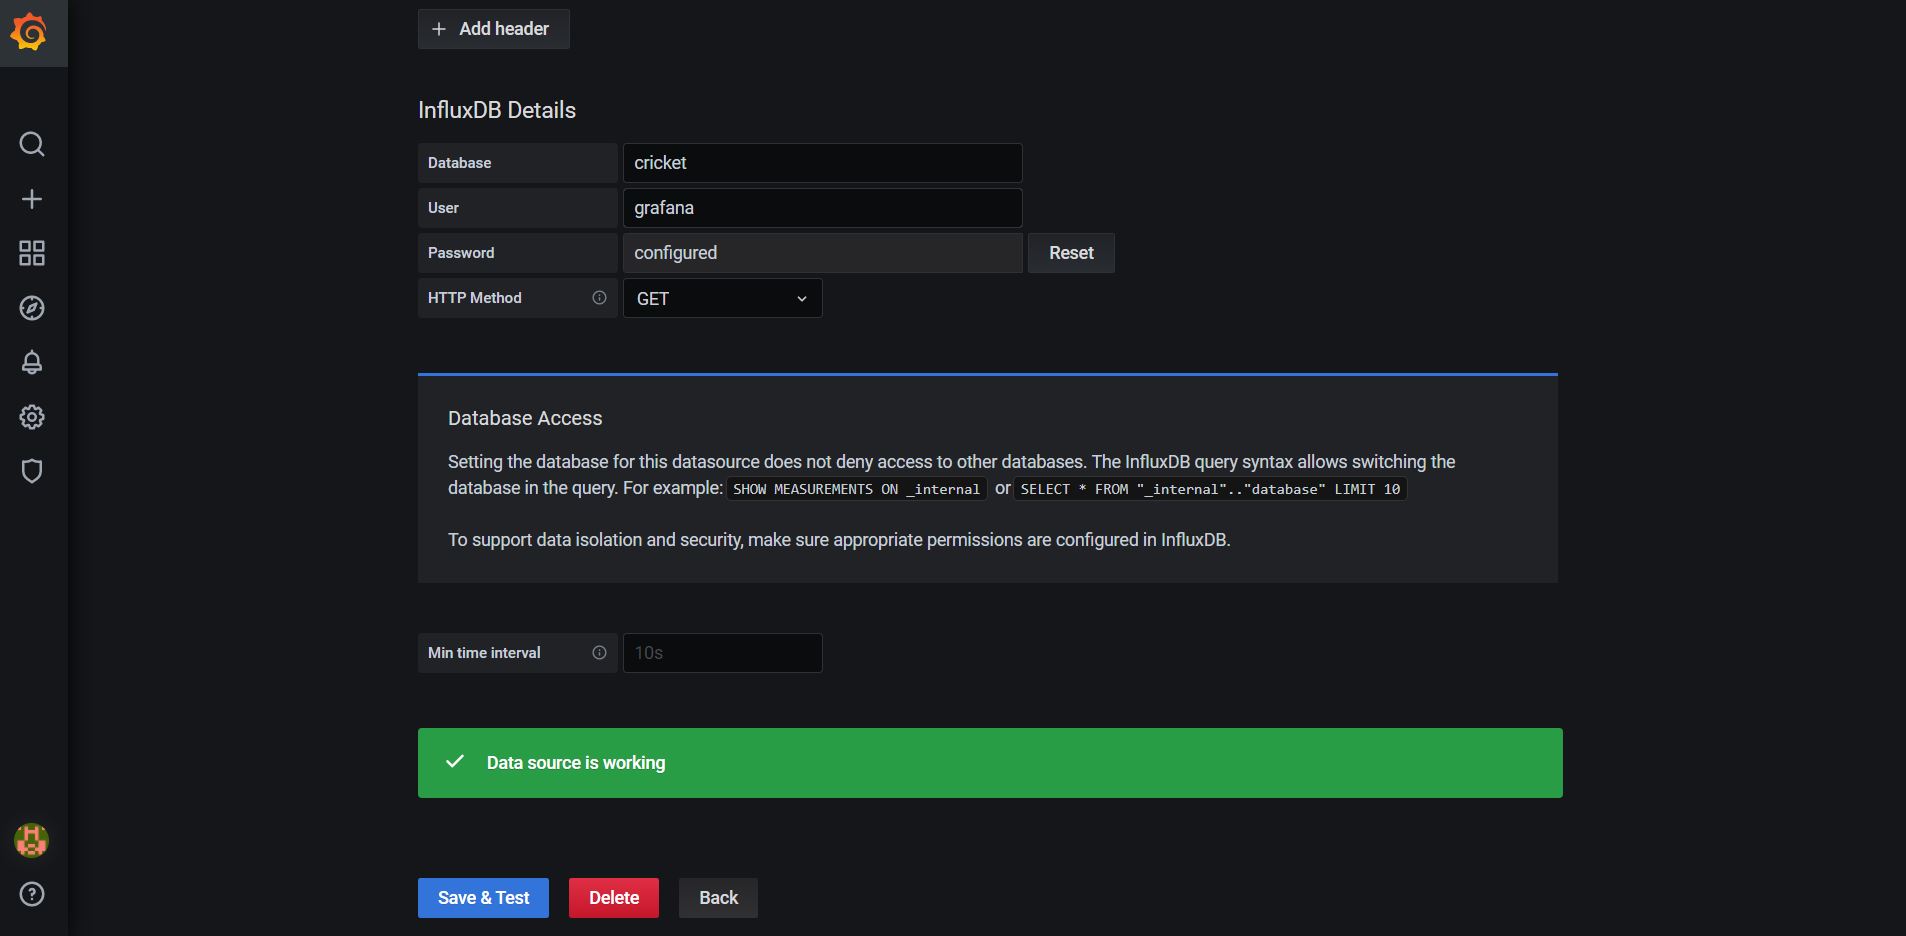
Further down the page, using the same details set up in Step 5 for the database:
- Add the name of the database cricket.
- Add the username grafana and password jg99ifF&kln
- Set Http Method to GET.
- Click Save and Test.
If all is well Grafana will show feedback or an error message.
- Go back to the home screen by clicking the Dashboard icon and choosing Home.
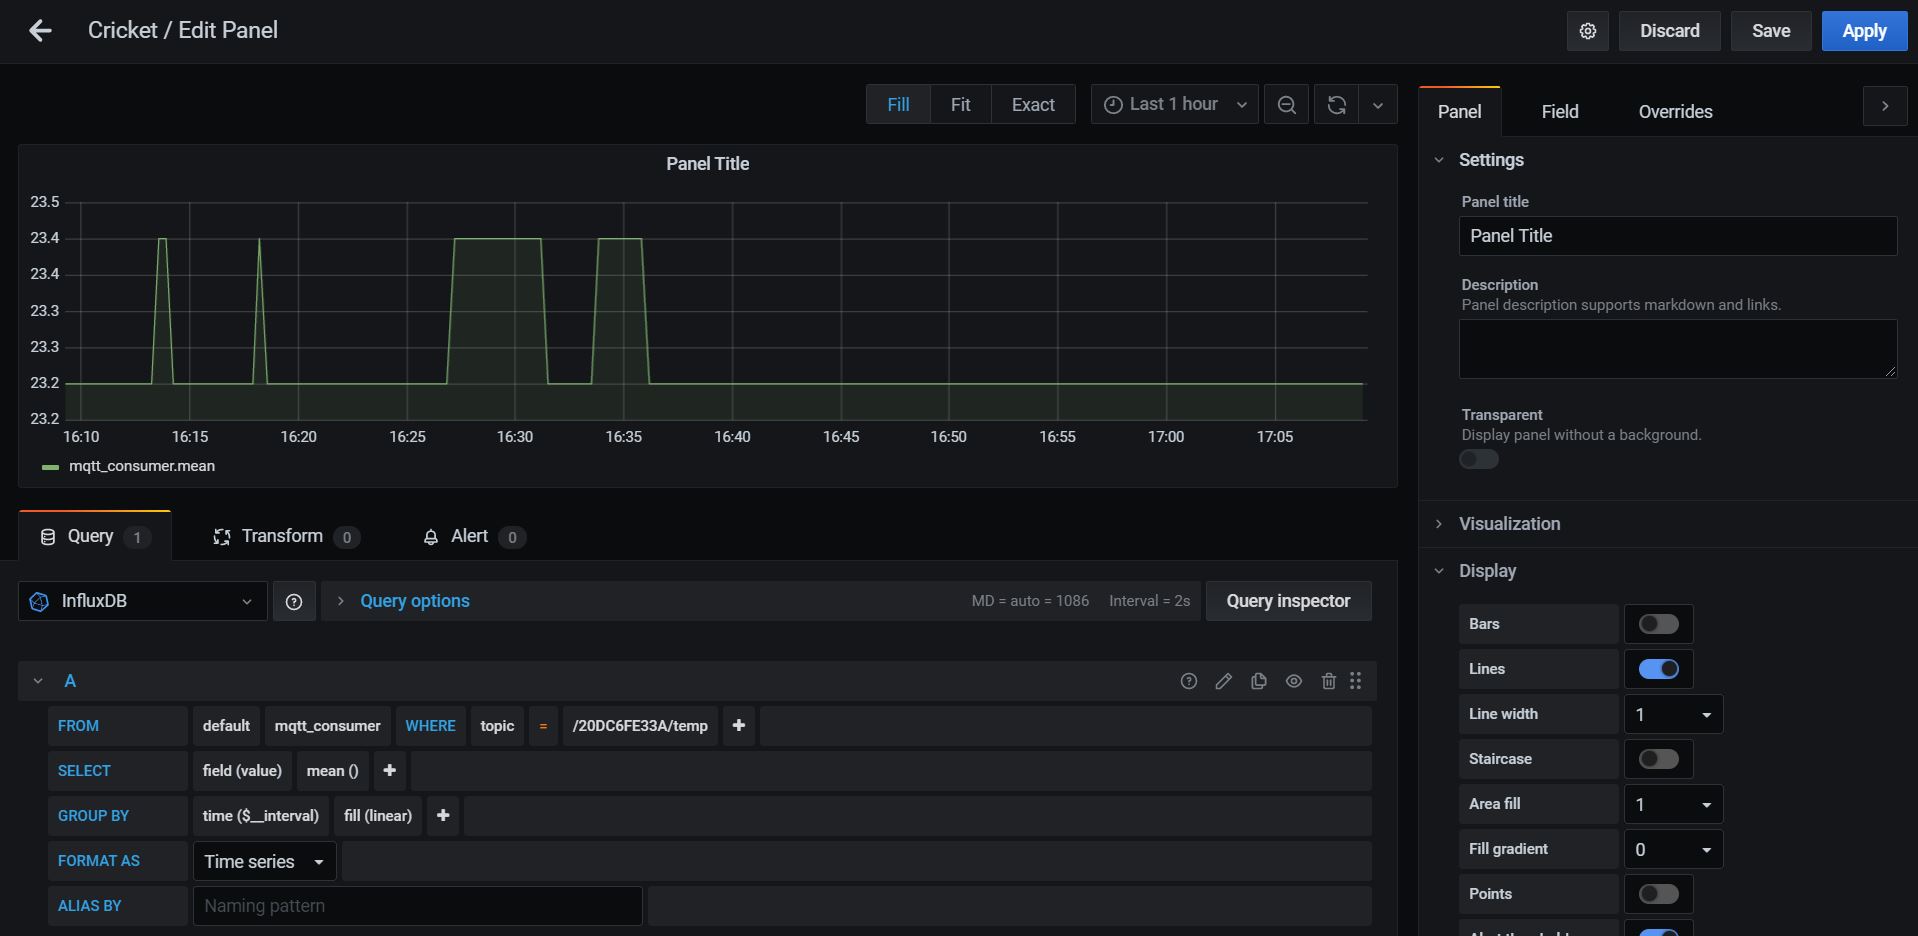
- Click Dashboards to go to the New Dashboard editor
- Click Add new panel – you will be taken to the Panel editor
- In the query section in the FROM row click select measurement and choose mqtt_consumer
- Click WHERE + and select topic
- Click = select value tag and select your Cricket topic path. (Ours is /20DC6FE33A/temp)
- Change GROUP BY to fill(linear).
- Click Save and give your dashboard a name. We called ours Cricket.
You should now have a nice time-series graph of your temperature readings.
Experiment with all the various settings and panels to build a dashboard that suits you. There are loads of panel types, trigger points, threshold levels and even alerts.
Grafana has brilliant documentation including video tutorials here.
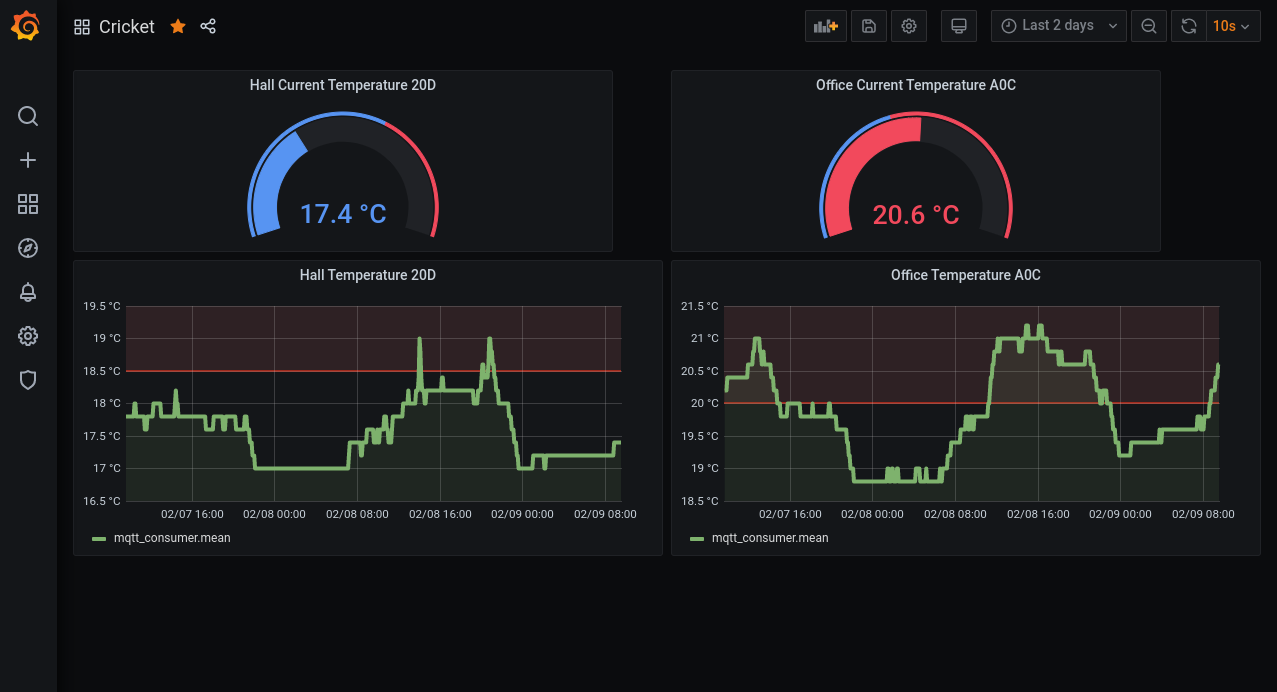
Here’s ours showing readings from 2 Crickets in different locations with gauges for current temperature and graphs for historical readings. The gauges change colour at different threshold temperatures.
8. Final tuning
Once everything is connected up and data is flowing:
- Go back to step 3.
- Attach to your Cricket AP and set its update rate to 5 mins.
You will then get really accurate temperature readings and extend the battery life to many months or longer.
Summary
This project has guided you through the basics of connecting Cricket modules to a Grafana dashboard using MQTT and InfluxDB with Telegraf.
If you followed the instructions carefully you should have a powerful IoT platform running on your Raspberry Pi that can support multiple Cricket modules deployed around any space with Wifi connectivity. Set up appropriately, each Cricket can run for many months on a set of batteries without writing any code.
More information about Cricket and the Open Source software used in this project is available:
Cricket: https://www.thingsonedge.com/
Mosquitto: https://mosquitto.org/
InfluxDB and Telegraf: https://www.influxdata.com/
Grafana: https://grafana.com/grafana/
Anyone for Cricket?
Like what you read? Why not show your appreciation by giving some love.
From a quick tap to smashing that love button and show how much you enjoyed this project.

