Debugging Raspberry Pi Pico is vital as programs become longer and more complicated, bugs are more likely to be introduced into the code and sometimes they can be quite difficult to track down. Using a debugger will not only help you find the bugs but will also give you a much better understanding of how your code works. This technique also flashes code to the Pico without having to reconnect the USB cable.
Specialised hardware debuggers are available but for debugging the Pico everything you need is built into the Raspberry Pi 4 Model B or Raspberry Pi 400 when used with the OpenOCD debug translator and Visual Studio Code.
This guide shows how to get started using a simple example application running on the Pico. It covers setting up a new project, stepping through the code line by line, using breakpoints and watching variables so you can see what’s happening in the processor’s memory to help you work out what’s going wrong.
1. Serial wire debugging
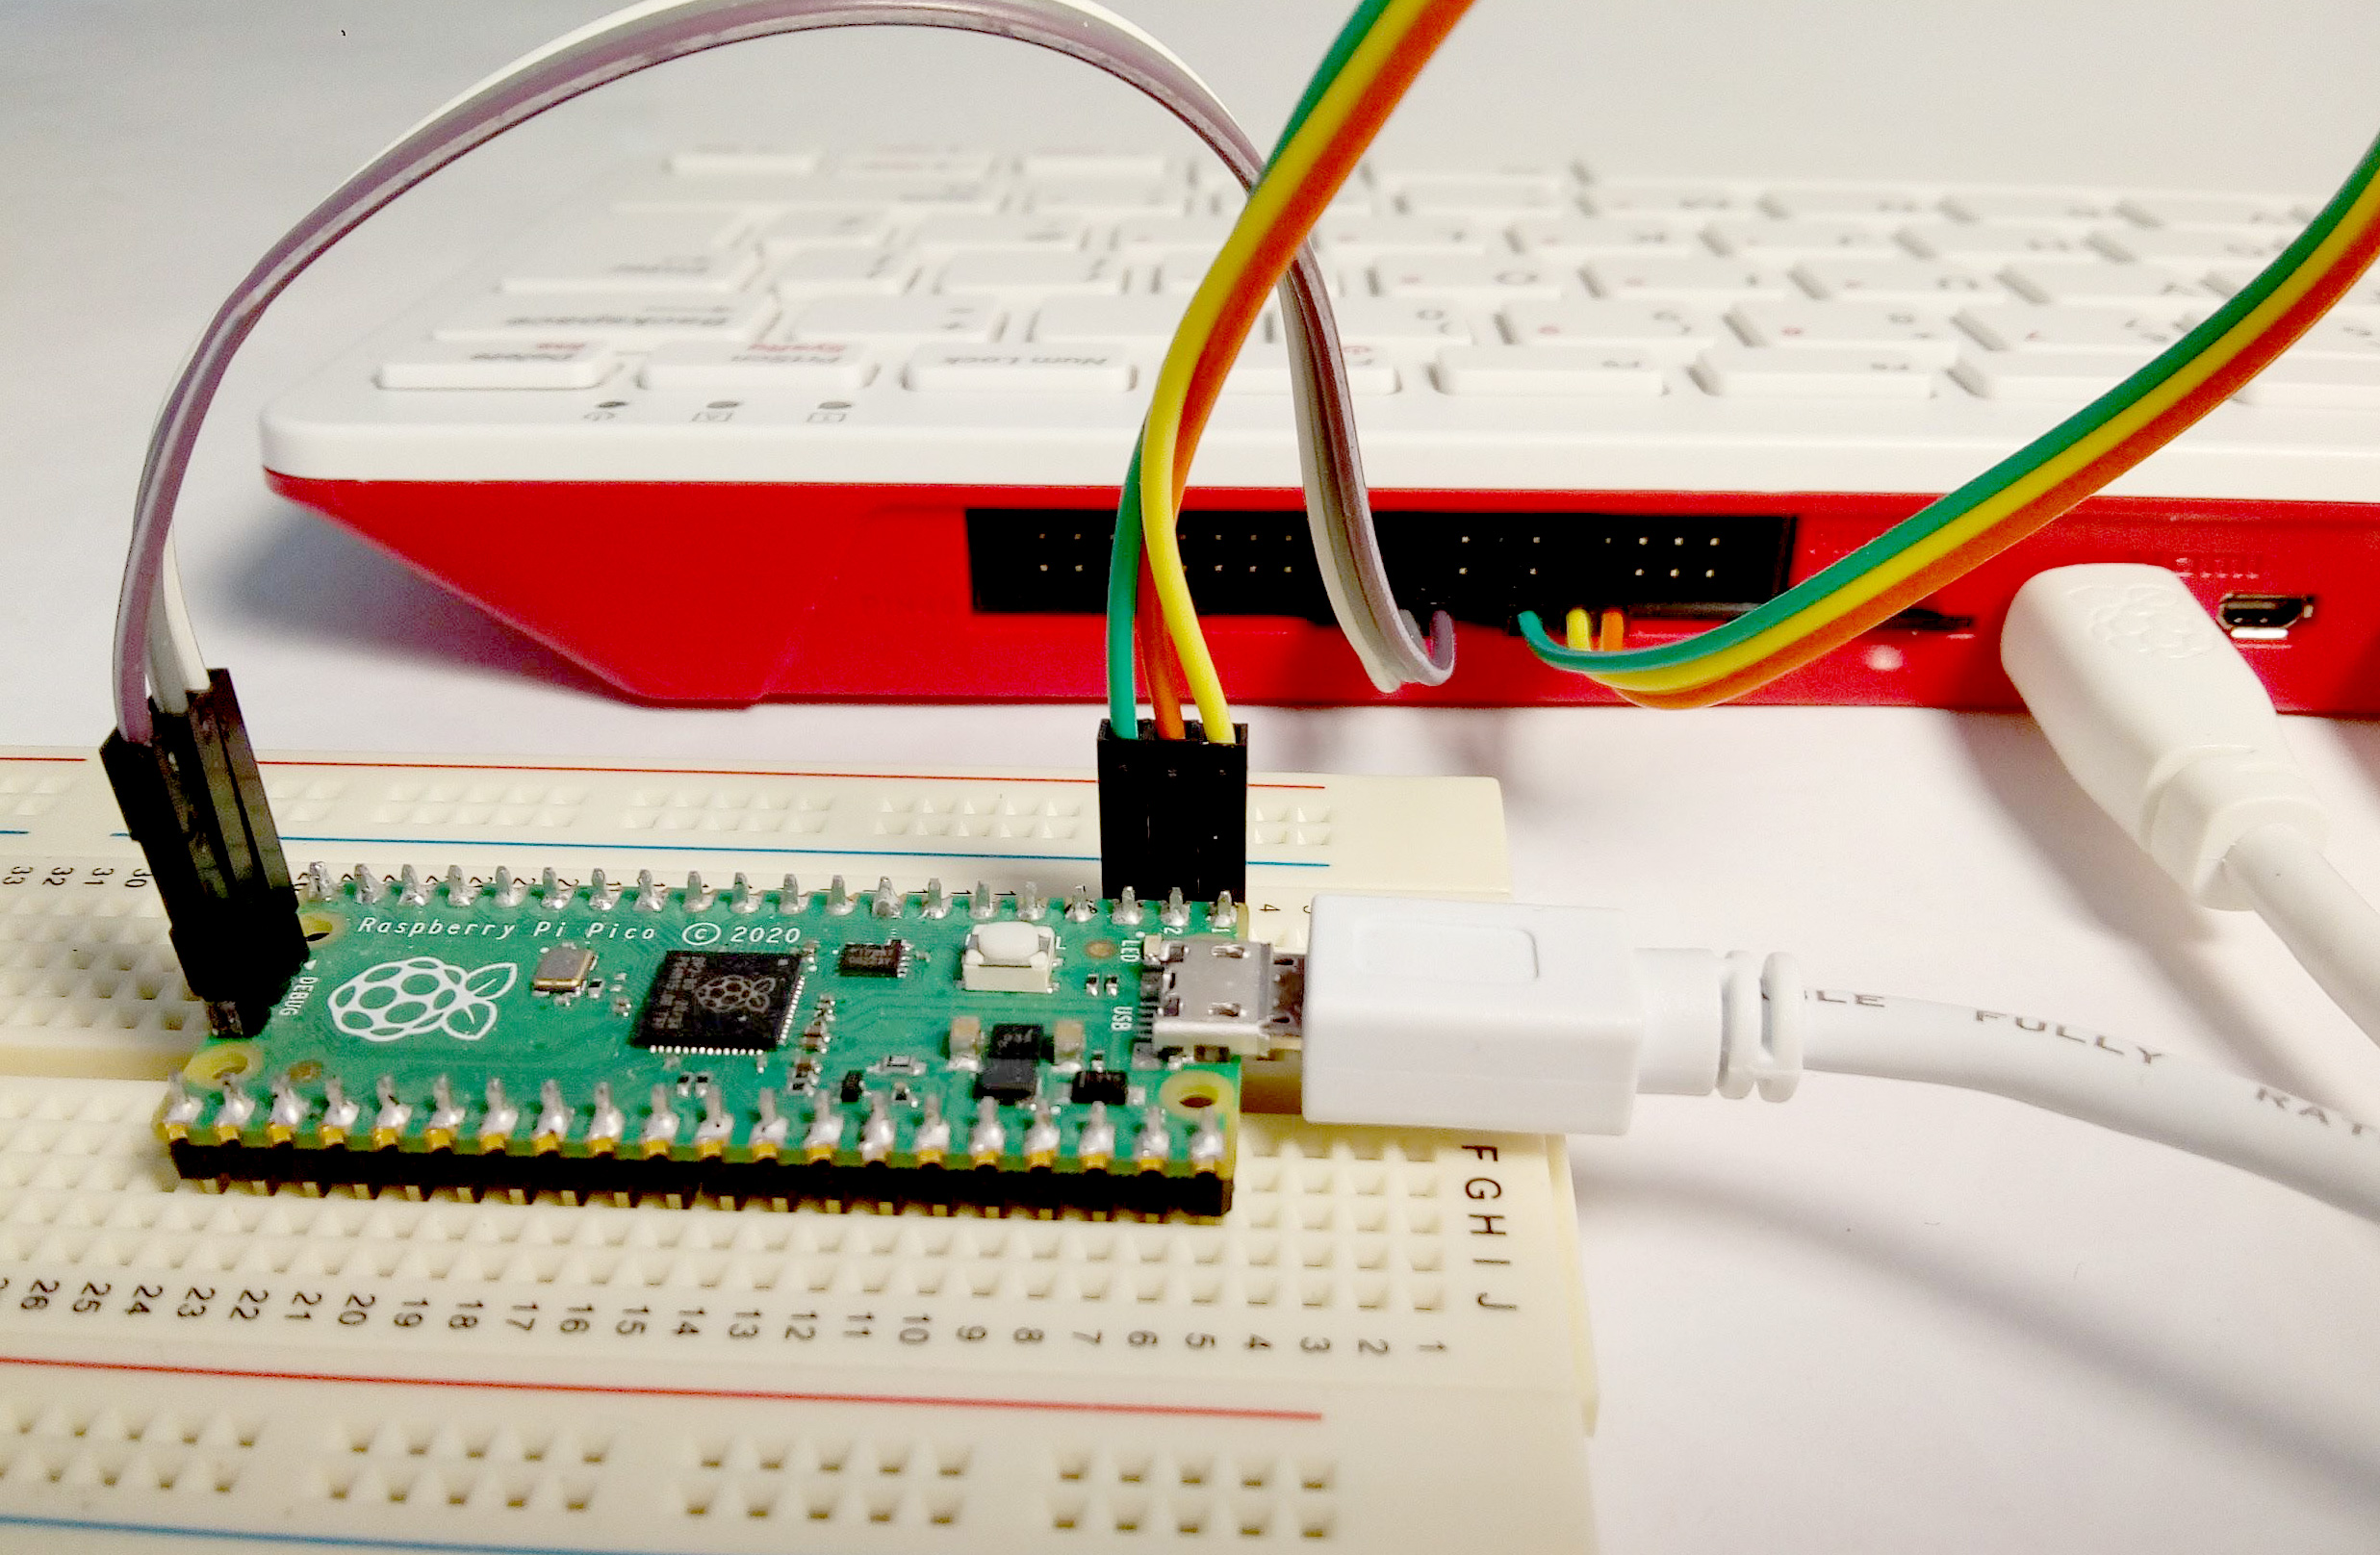
Raspberry Pi Pico has a special Serial Wire Debug (SWD) connector marked DEBUG on the end of the board, which is used to connect to an external debugger or to the Raspberry Pi GPIO connector.
Make sure the Raspberry Pi is powered down and the power supply removed before making any connections, then check them carefully before powering on.
For the SWD port connect three female / female jumper cables from the Raspberry Pi to the Pico:
| Raspberry Pi | Pico | Colour |
|
GPIO24 (Pin 18) |
SWDIO |
purple |
|
GND (Pin 20) |
GND |
grey |
|
GPIO25 (Pin 22) |
SWCLK |
white |
To view output from the Pico also connect the serial UART with three more jumper wires:
| Raspberry Pi | Pico | Colour |
|
GPIO14 (UART0_TX, Pin 8) |
UART0_RX (Pin 2) |
orange |
|
GPIO15 (UART0_RX, Pin 10) |
UART0_TX (Pin 1) |
yellow |
|
GND (Pin 14) |
GND (Pin 3) |
green |
Power the Pico by connecting a micro USB cable to the Pico from the Raspberry Pi.
2. Build the circuit
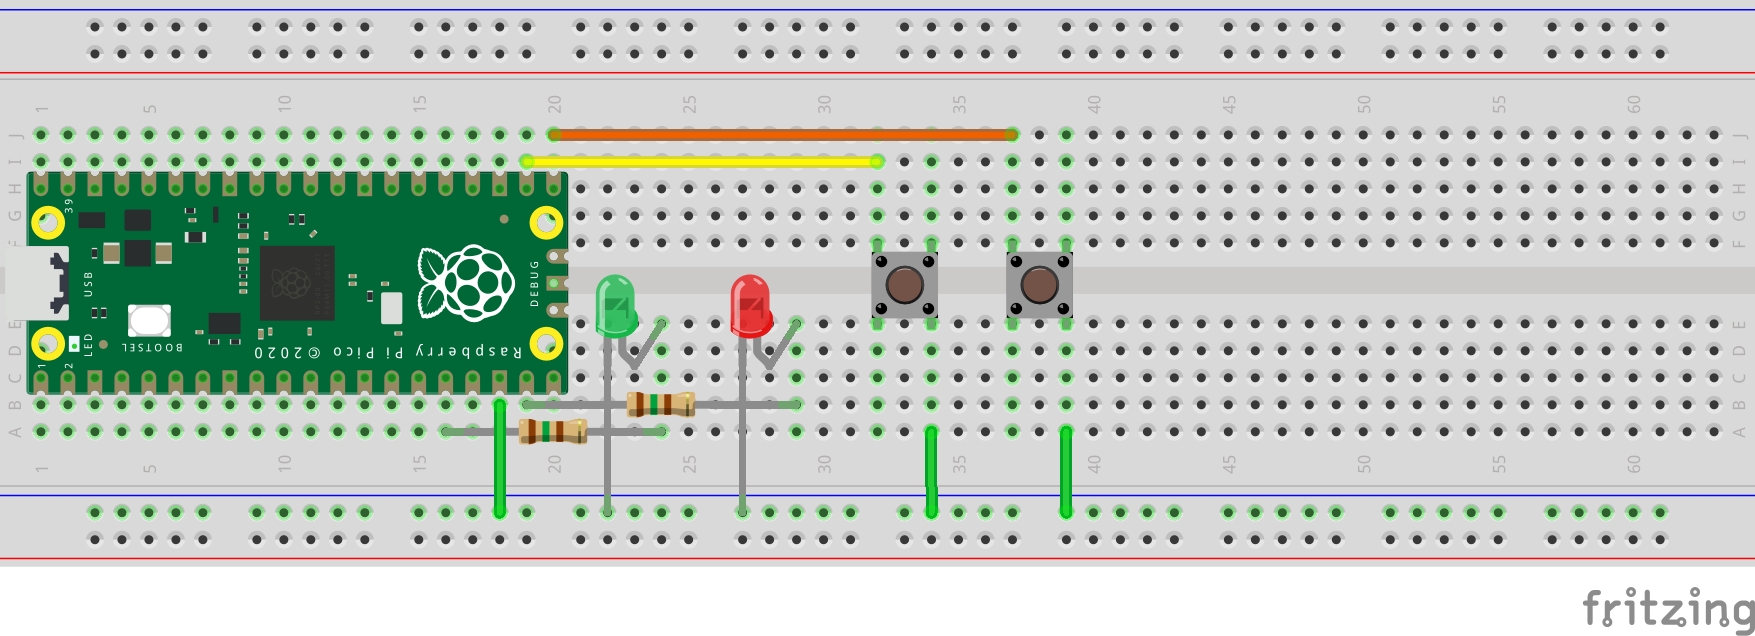
The example is based on an entrance light queuing system that allows a maximum number of people to enter a building at any given time. A green light indicates it’s ok to enter. As each person enters, a counter is incremented. Every time a person leaves the count is reduced. If too many people are in the building, a red light stops anyone else from entering.
The circuit consists of green and red LEDs with 150 Ohm current limiting resistors and 2 momentary buttons to simulate entering and leaving:
| Pin No | GPIO | Component |
|
16 |
GP12 |
green LED |
|
18 |
GND |
|
|
19 |
GP14 |
red LED |
|
21 |
GP16 |
IN button |
|
22 |
GP17 |
OUT button |
3. New project
We’re assuming that you’ve already set up OpenOCD and VSCode on your Raspberry Pi host and that you can open and run an example project. You can learn how to do that here.
Before creating a new project let’s make sure that the Pico SDK is up to date:
cd pico-sdk
git pull
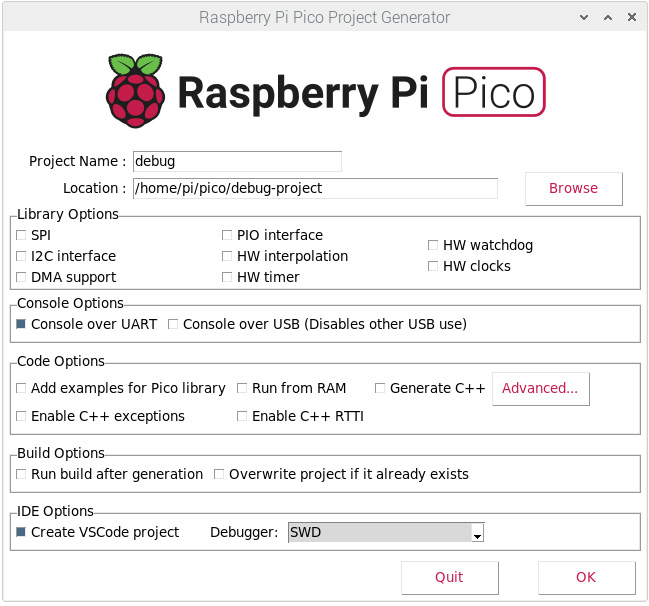
git submodule updateThe easiest way to create a new C/C++ project and configure the debugging features of VSCode is to use the project generator tool that comes with the Pico SDK:
cd pico
cd pico-project-generator
./pico_project.py --gui- Name your project and chose a directory that already exists.
- Check Console over UART and Create VSCode project.
This will create a directory for your project with a .vscode sub-directory containing the configuration files launch.json and settings.json needed to set up VSCode for debugging the Pico.
Open the project in Visual Studio Code:
- Open VSCode from the main menu Programming > Visual Studio Code and let it load the extra components.
- Open your project directory from the VSCode menu File > Open Folder.
- Allow any pop-ups to close by themselves.
- When the project opens click on the generated .c file in the explorer pane.
The default “hello world” code will load in the editor.
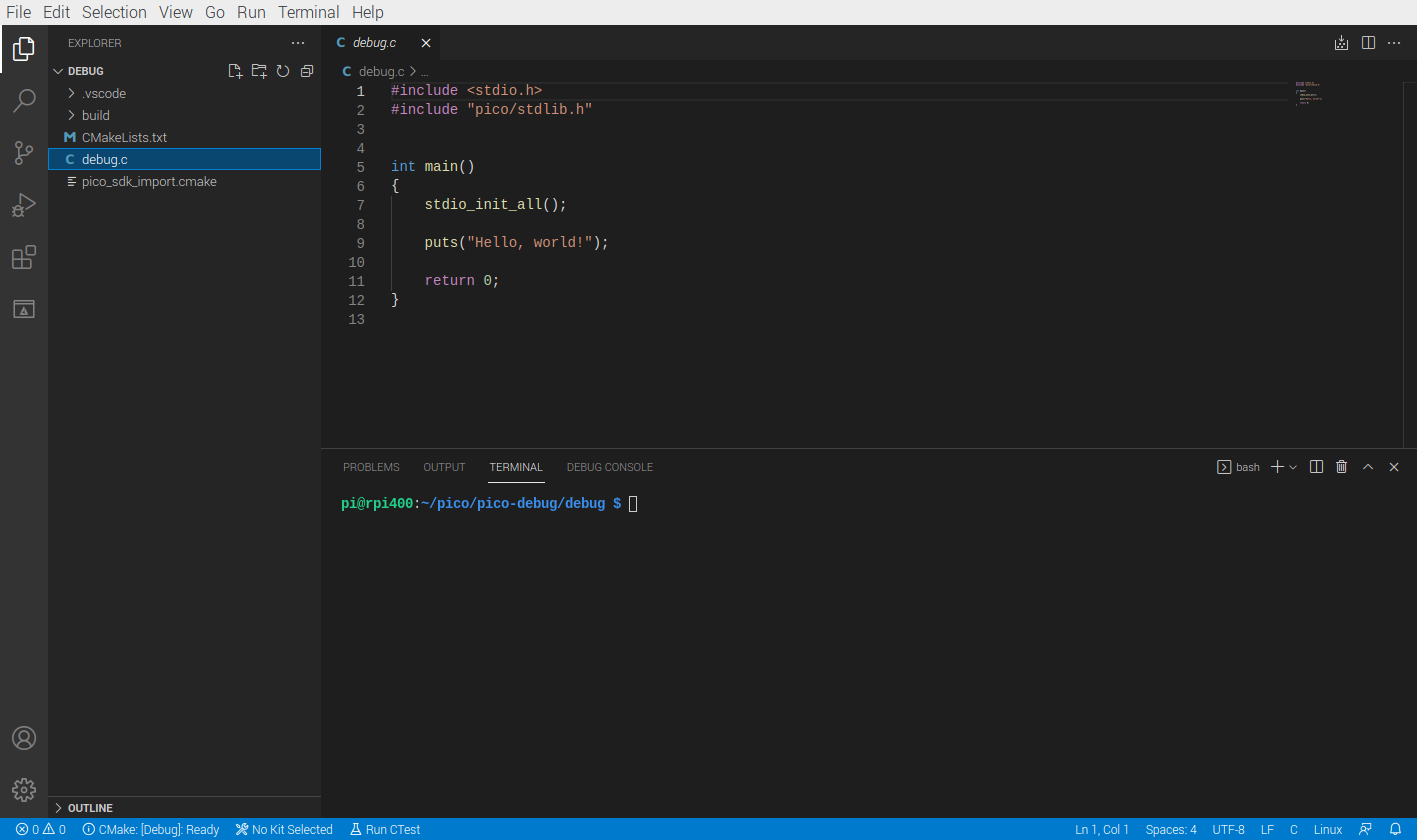
VSCode needs to be configured with a compiler before the project can be built:
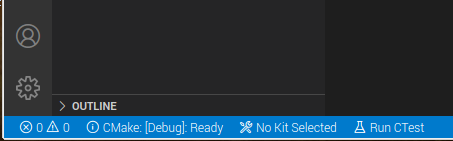
- Click No Kit Selected in the bottom blue status bar.
- Choose GCC x.x.x arm-non-eabi – NOT arm-linux-gnueabihf from the dropdown.
Now the project can be built and debugged:
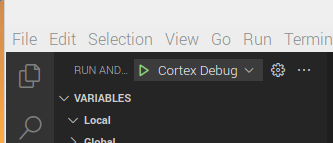
- Open the debug pane by clicking the Bug icon in the left-hand bar.
- Click the green Cortex Debug button at the top of the debug pane.
CMake will run and a list of launch targets will appear:
- Select your project in the drop-down and CMake will configure then build it.
VSCode will switch to Debug Mode with the window outline shown in orange – the project will be loaded and stopped at the first line in the main function and the Debug Console will open.
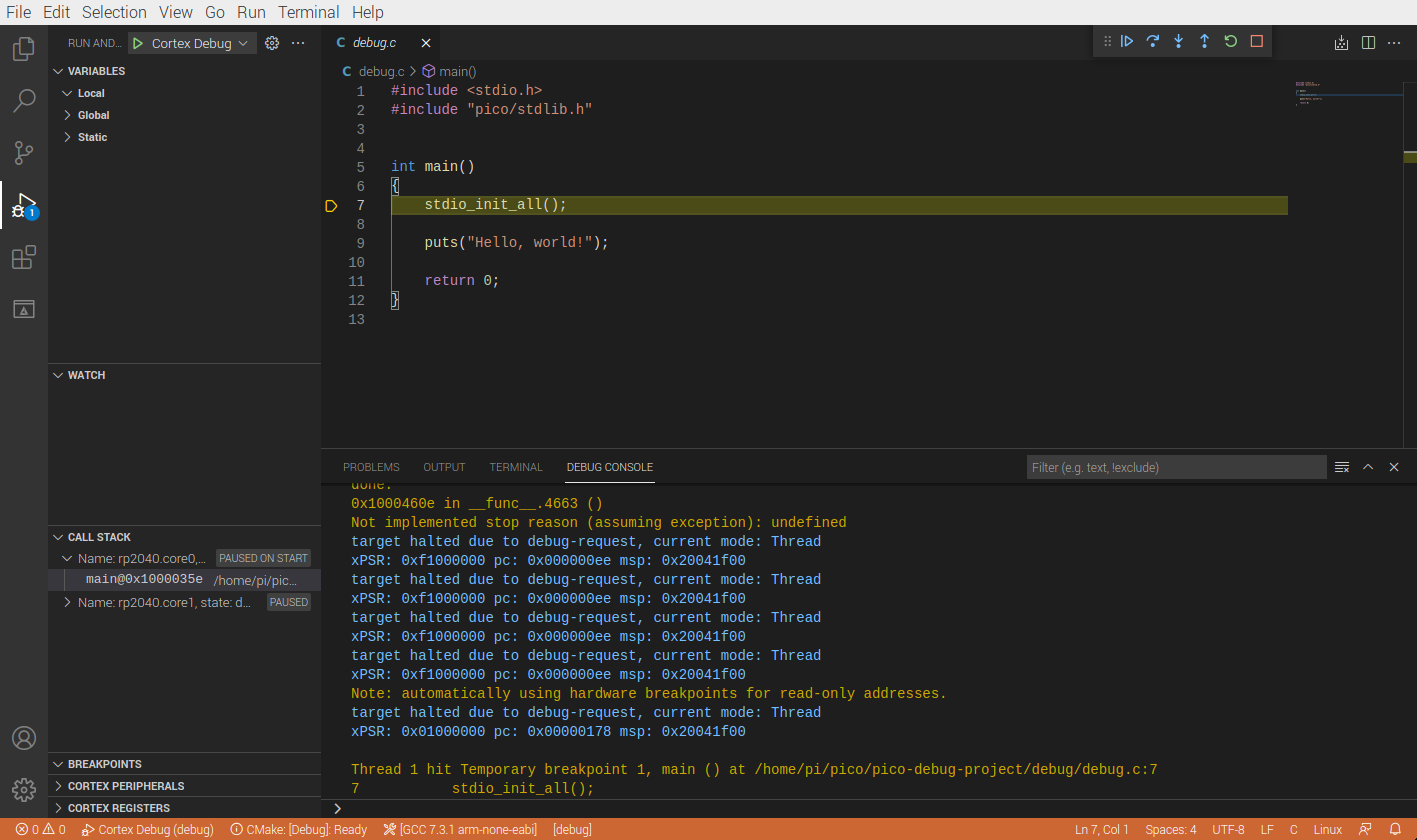
The debug controls are displayed in their own pane at the top of the editor view, from left to right:
- Continue (F5)
- Step over (F10)
- Step into (F11)
- Step out (Shift+F11)
- Restart (Ctrl+Shift+F5)
- Stop (Shift+F5)
![]()
The output can be viewed in minicon by opening a new Terminal or by using the terminal within VSCode:
- Click the Terminal tab in the bottom pane and enter the following bash command.
minicom -b 115200 -o -D /dev/serial0- Click the Run debug button and the “Hello World” output will appear.
- Click the Red Stop Debugging (Shift + F5) icon.
4. Entry system
Now the debugger is working with the test sample, we can add our entry system code. The code uses interrupts on the buttons to increment or decrement a counter. The value of the counter is tested in the main loop which determines whether to display a green or red light.
Cut and paste the code below overwriting the default code:
#include <stdio.h>
#include "pico/stdlib.h"

const uint GREEN_LED_PIN = 12U;
const uint RED_LED_PIN = 14U;
const uint IN_BUTTON_PIN = 16U;
const uint OUT_BUTTON_PIN = 17U;
volatile uint counter = 0;

void button_callback(uint gpio, uint32_t events) {
    if (gpio == IN_BUTTON_PIN){
        counter ++;
    }
    else if (gpio == OUT_BUTTON_PIN) {
        counter --;
    }
}

int main()
{
    stdio_init_all();

    gpio_init(GREEN_LED_PIN);
    gpio_set_dir(GREEN_LED_PIN, GPIO_OUT);

    gpio_init(RED_LED_PIN);
    gpio_set_dir(RED_LED_PIN, GPIO_OUT);

    gpio_init(IN_BUTTON_PIN);
    gpio_pull_up(IN_BUTTON_PIN);

    gpio_init(OUT_BUTTON_PIN);
    gpio_pull_up(OUT_BUTTON_PIN);

    gpio_set_irq_enabled_with_callback(IN_BUTTON_PIN, GPIO_IRQ_EDGE_FALL, true, &button_callback);
    gpio_set_irq_enabled(OUT_BUTTON_PIN, GPIO_IRQ_EDGE_FALL, true);

    while (1) {
        if (counter <= 2) {
            gpio_put(GREEN_LED_PIN, 1);
            gpio_put(RED_LED_PIN, 0);
        }
        else {
            gpio_put(RED_LED_PIN, 1);
            gpio_put(GREEN_LED_PIN, 0);
        }
    }
}
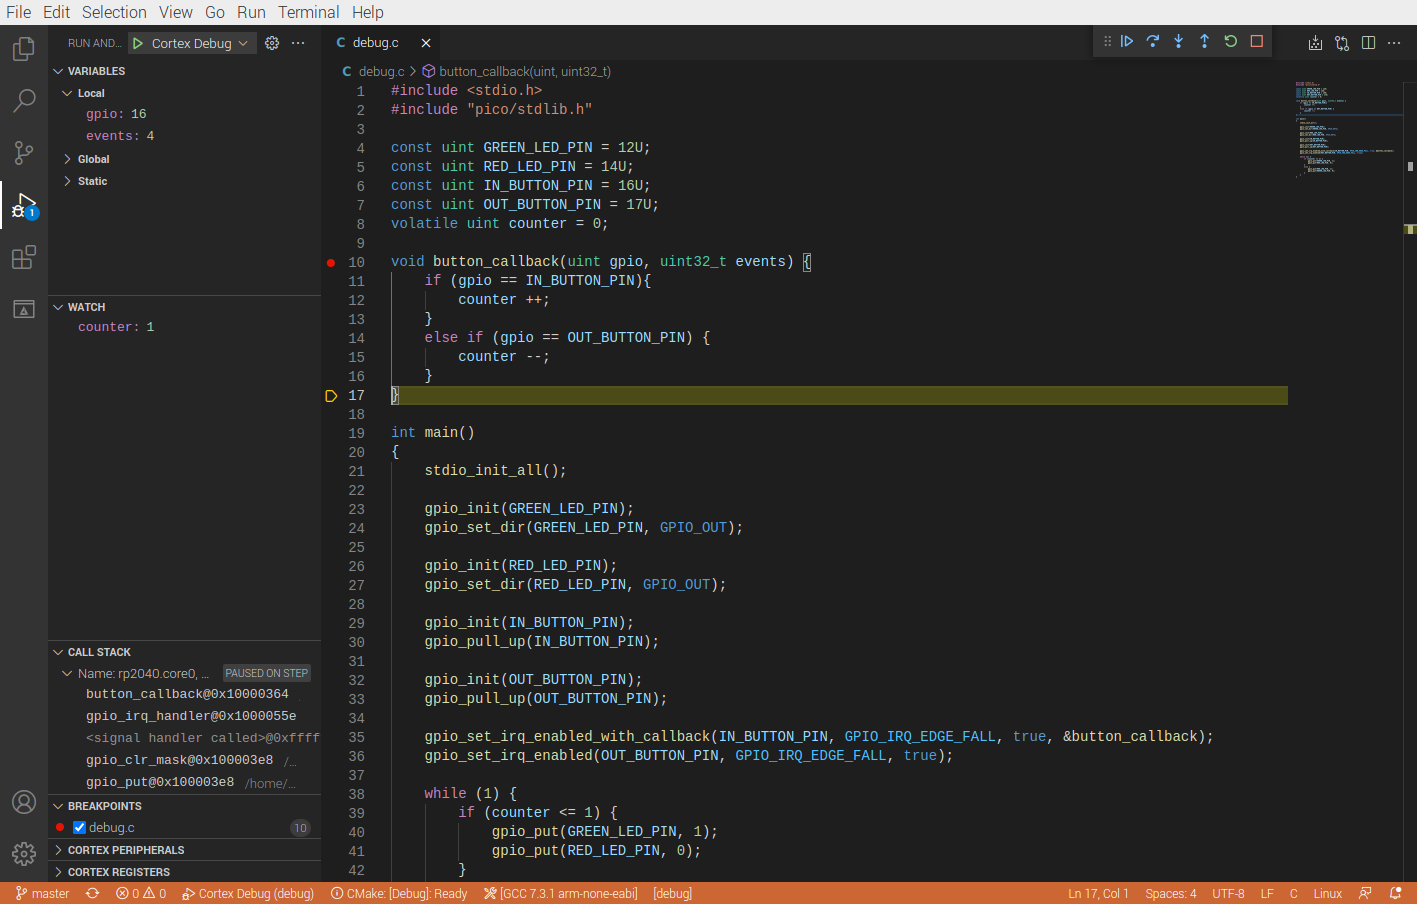
- Click in the margin at line 10 to add a breakpoint at the button callback.
- In the Watch window click the + sign and add the counter variable.
- Start debugging by clicking the Cortex Debug green arrow.
- When the debugger stops at main, press the debug Continue control (F5) which will start the program and the Green LED will turn on.
- Press the IN button, the program will stop at the callback function and the counter variable will show 0.
Note: the debug pointer stops before the code in the callback function executes
- Press the Step Into control (F11) and watch the counter increase to 1.
- Continue stepping through until the end of the callback then press Continue (F5).
If you repeat this on the third press the red LED will turn on.
Everything is working as expected, the counter is incrementing with each button press and the green and red LEDs are coming on at the right time.
5. Finding bugs
Let’s try decrementing the counter.
- Click the Restart control (Ctrl+Shift+F5).
- Click the Continue control (F5) to start the program again – the green LED will be on.
- Press the OUT Button and Step into control (F11).
The red LED will come on and the counter variable will display a very large number because the unsigned integer variable has overflowed, which is a bug.

To fix this we need to add a guard to prevent the counter from decreasing below zero. Change the else if statement in the callback as below:
void button_callback(uint gpio, uint32_t events) {
    if (gpio == IN_BUTTON_PIN){
        counter ++;
    }
    else if ((gpio == OUT_BUTTON_PIN) && (counter > 0)) {
        counter --;
    }
}
Run Cortex Debug again to save and recompile the changes and repeat the step-through exercise above. You should see that the counter variable no longer overflows and the program is working as expected and the bug is fixed.
Summary
In this guide, we have shown how to set up a new C/C++ project for the Raspberry Pi Pico and use key debugging features of Visual Studio Code.
We used breakpoints and watches to allow us to step through sections of the code to see what was happening in memory to find and fix a problem.
VSCode has very good online documentation accessible from the Help menu.
A searchable version of all the Pico documentation can be found here:
https://raspberrypi.github.io/pico-sdk-doxygen/
Happy debugging!
Like what you read? Why not show your appreciation by giving some love.
From a quick tap to smashing that love button and show how much you enjoyed this project.

