This project shows you how to set up an energy monitoring smart meter with Arduino to help save electricity usage. Understanding your energy consumption is becoming more and more important due to its effect on climate change and the rising cost of electricity.
Following the below 7 steps, you’ll be able to measure electrical power in a home using current transformers. They are a safe way to measure current indirectly without connecting to the mains.
We build a simple but accurate energy monitor that will give comparable readings to an electricity supplier’s Smart Meter, going into the details of the circuit design and coding principles. We also show how to customise a display using an e-Paper display module.
Let’s see below a short video showing a test of the power meter using an electric kettle:
Warning: Current Transformers are not directly connected to mains, but they do need to be clamped around an insulated, live mains power cable – Always switch off the power supply before doing so.
Step 1: AC power
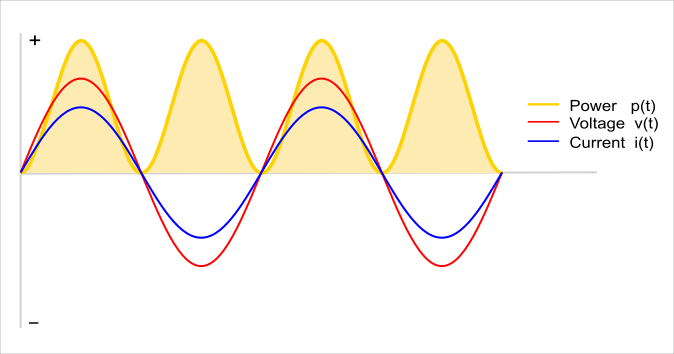
For resistive loads like kettles, ovens and immersion heaters, the instantaneous power can be calculated using Ohm’s Law and is the product of instantaneous voltage and current; since both values are in phase, power is always positive.
The energy change for Alternating Current (AC) that is equivalent to Direct Current (DC) can be calculated by the Root Mean Square (RMS) of the current (Irms).
So the Real Power, which is what your electricity company charges you for, is the product of RMS voltage and RMS current:
Real Power = RMS Voltage x RMS Current*
*For resistive loads – if you want to know the full story, see this article.
Step 2: Current Transformers
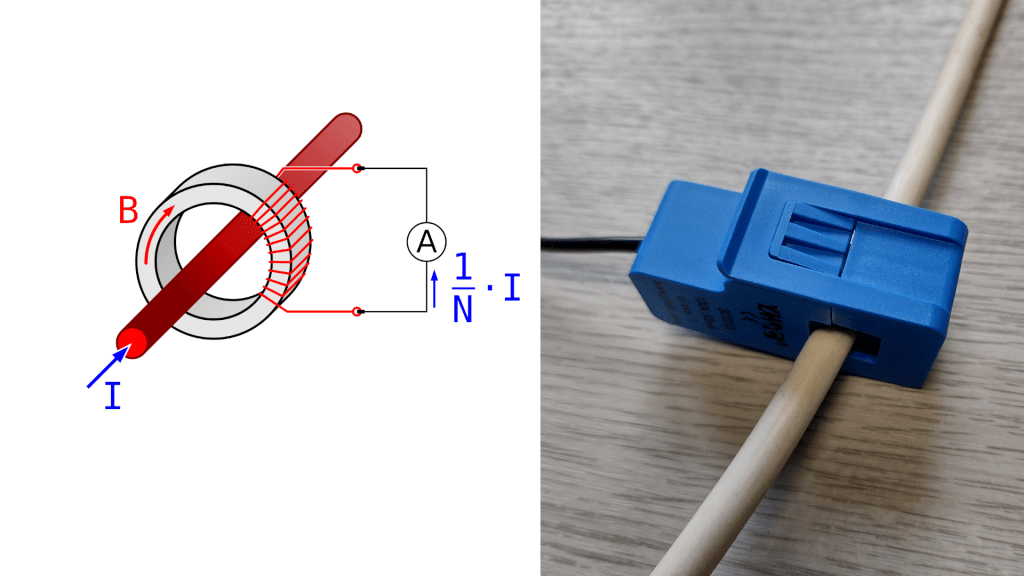
Current transformers (CT) are a specialised type of transformer where the primary coil is the Line cable in your building wiring, and the secondary coil is connected in series with a low-value resistor called a Burden resistor. The small current flowing in the burden resistor generates a voltage across it which can be measured and used to calculate the current flowing in the primary circuit.
The CT we are using is rated at 100A, so it’s suitable for measuring the total power in a domestic home. It has 2000 turns : 1, so at its maximum primary current rating of 100A, it induces a 50mA secondary current:
100A / 2000 = 50mA
Step 3: ADC
The Arduino Nano Every is based on the ATMega4809 microcontroller, which has a 10-bit (0 – 1023) Analogue to Digital Converter (ADC) for measuring voltages between 0V and 5V. This gives a resolution of 4.9mV per division which is quite sensitive:
5000mV / 1024 = 4.88mV
The ADC can only measure voltages between 0V and 5V (it can be damaged if you exceed these limits), but the mains AC current alternates above and below zero, so the current in the burden resistor will do so in proportion.
If the signal is offset by a DC voltage at 2.5V (called DC biassing) the burden resistor can be sized such that the peak to peak (P2P) voltage is just below 5V, so we get the highest resolution and stay within the ADC tolerances.
Here is how the burden resistor is calculated for a 100A @ 50mA CT:
Primary P2P current = 100A rms x = 100 x 1.414 = 141.1A
Secondary P2P current = Primary P2P current / Turns = 141.1 / 2000 = 70.7mA
Burden resistance = 2.5V / Secondary P2P current = 2.5V / 70.7mA x 1000 = 35.4 𝝮
33 Ω is the closest standard resistor size below, giving a margin of safety for the ADC and is sufficiently low to prevent the CT from saturating.
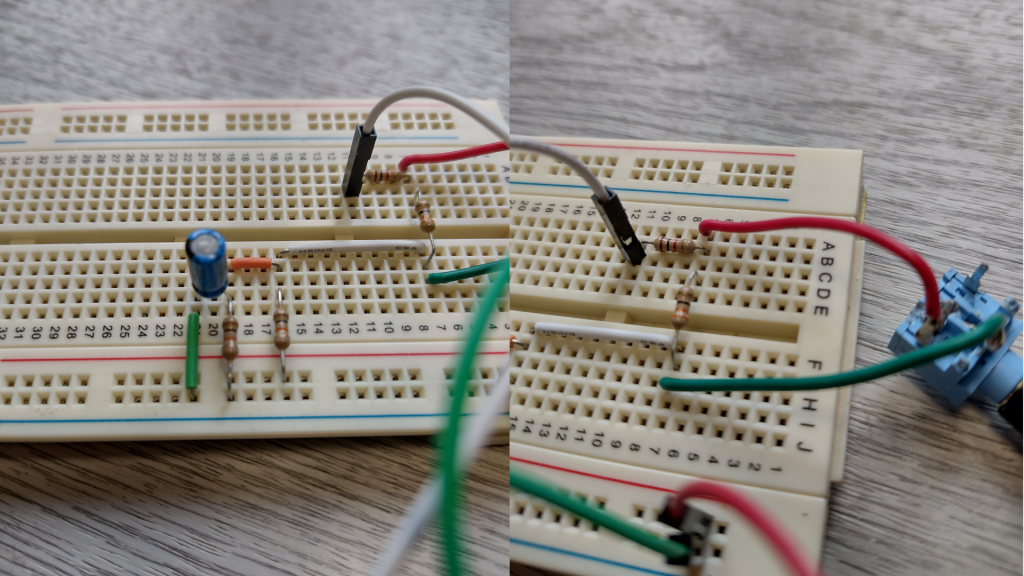
Step 4: Circuit
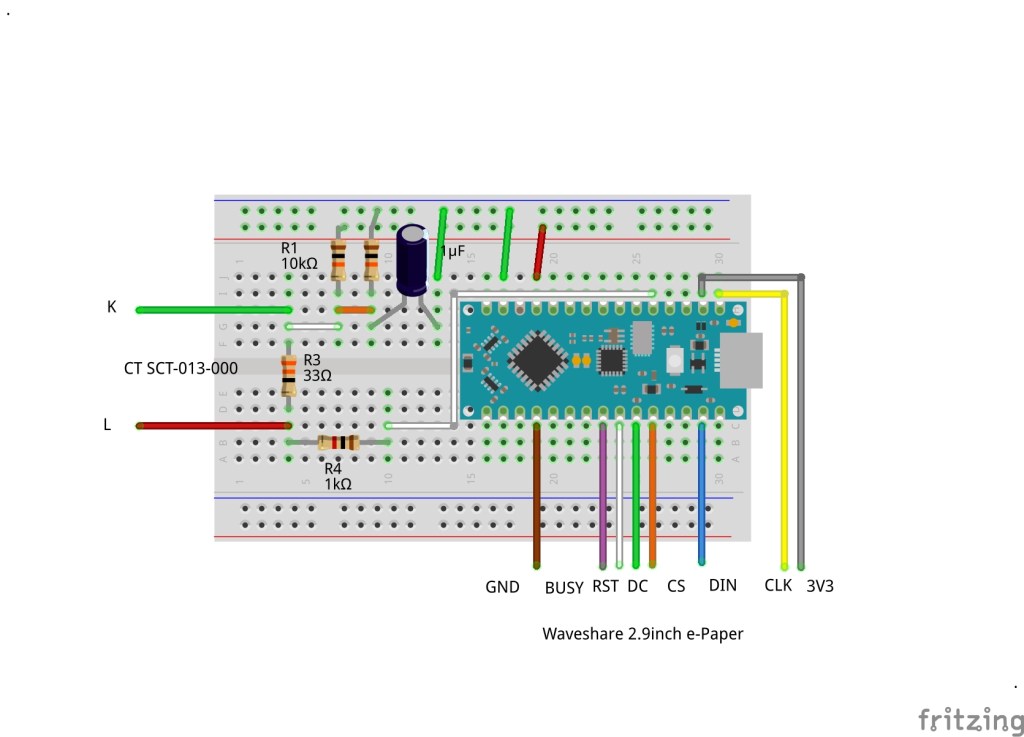
The circuit is very simple. Two 10k Ohm resistors, R1 & R2, form a voltage divider which halves the 5V supply voltage provided by the Arduino’s 5V pin to 2.5V. This creates the DC offset for the CT, which is connected between the centre of the voltage divider and the analogue input A1 using a standard microphone jack.
The 33 Ohm Burden resistor R3 is connected across the CT terminals, and a 1uF capacitor provides a low impedance by-pass to the ground. The 1k Ohm current limiting resistor R4 protects the ADC pin.
All the other connections are for the e-Paper display, which is detailed next.
Warning: Never install the CT with the power on. Always make sure the burden resistor is connected before turning on the power. The CT recommended for this project has a diode for protection and safety built into the device.
Voltage divider & burden resistor circuits:
Step 5: e-Paper Display
e-Paper (EPD) or e-ink displays are now relatively inexpensive and can produce interesting custom displays. You can create your own images as backgrounds and define small areas of overlay to display dynamic data, which updates quickly. There are also different colour options.
Images require a certain amount of memory or storage for data. Fortunately, the Arduino Nano Every has 48kB of flash memory that can be used to store static data using the PROGMEM function, which works well with our selected display.
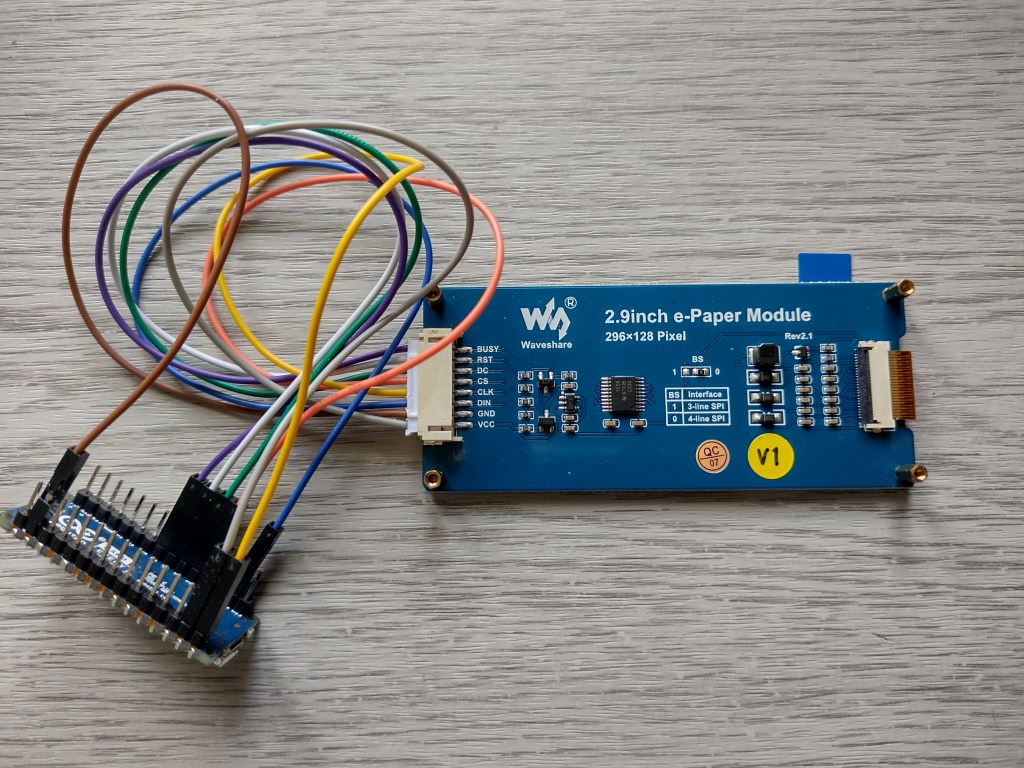
We used a Waveshare 2.9inch e-Paper Module with 128 x 296 pixels in black and white. Drivers are available for download from the Waveshare GitHub.
We included the necessary files for this project in our code repo, along with the background image.
If you use the original libraries from Waveshare, clone the repo onto your PC and copy the relevant drivers for your module into the same directory as your Arduino code.
git clone https://github.com/waveshare/e-Paper.gitTip: There are many different Waveshare e-Paper modules – it is not always clear which version you have purchased. SKU and board Revision numbers can be the same for different module versions (requiring different drivers). Some have built-in SPI interfacing hardware on the back of the board, and some are just bare screens that require a separate driver board. The boards we tested had onboard interfacing and 3.3 / 5V level shifting (some early versions are not 5V compatible) – We marked ours with our own version stickers.
The Waveshare GitHub download contains driver software for several different host devices like Raspberry Pi, Jetson Nano & Arduino. The Arduino drivers are in the Arduino directory. Each board version has a subdirectory containing separate driver and font files.
Board Rev 2.1, Board Version 1 (No marking), Driver ../Arduino/epd2in9/
Board Rev 2.1, Board Version 2 (Marked V2), Driver ../Arduino/epd2in9_V2/
Copy all the relevant driver files into your Arduino project and edit the epdif.h file to match these Arduino Nano Every pin definitions:
// Pin definition
#define RST_PIN  6
#define DC_PIN   7
#define CS_PIN   8
#define BUSY_PIN 5| Display | Nano | Colour |
| BUSY | D5 | Purple |
| RST | D6 | White |
| DC | D7 | Green |
| CS | D8 | Orange |
| CLK | CLK (D13) | Yellow |
| DIN | COPI [MOSI] (D11) | Blue |
| GND | GND | Brown |
| VCC | 3V3 | Grey |
We recommend flashing the epd2in9-demo code included in our repo to test your EPD before connecting up the current sensing circuit. It displays a static OKdo logo as a background image across the whole 128 x 296 display and overlays this with text boxes that do partial updates to keep the display snappy.
Our 128 x 296 pixel board with integrated driver and level shifting:
Step 6: Code
The code for the project can be downloaded from OKdo’s GitHub repository. It measures the voltage across the burden resistor by rapidly sampling the ADC to digitise the AC signal by filtering out the DC offset and calculating the RMS current in the secondary coil. This is then scaled to the RMS current in the primary coil.
A fixed value is used for the primary RMS voltage so the Real Power can be calculated along with the cost per kWh. This is a simplified approach but is easier to understand and code, but it works really well. We got well within 2% of our electricity company’s smart meter readings.
Important values are configured at the top of the listing; some of them can be adjusted to obtain more accurate readings. Details of calibrating these are in the next section.
The current ratio is set according to the number of turns in the CT’s secondary coil divided by the value of the burden resistor:
const float current_ratio = 2000.0 / 33.0;Note: In C/C++, it is important to include decimal places for floating point numbers to indicate to the compiler; otherwise, you can get integer arithmetic which will give very different results!
This is the DC bias set by the resistor divider circuit – both resistors should be about the same value, so it should be set to 512.
int16_t adc_bias = 512;The next macro sets the value for the Arduino supply voltage – this is used in converting the ADC reading, which is an integer into a voltage – nominally, it is 5V but can be adjusted.
#define ARDUINO_V 4.8Your electricity cost per kWh is set in this macro – ours is in pence, and it is multiplied by the power figure to obtain the cost shown on the display:
#define COST_PER_KWHR 28.5The final value of importance is the mains RMS voltage – this varies depending on your location – ours is about 240V:
#define MAINS_V_RMS 240.0The low pass filter function removes the DC bias from the AC signal. We put it in its own file so we could test it – lowpass.h & lowpass.cpp
It takes two parameters, a pointer to the bias variable and the ADC reading, which will be a value between 0 and 1023. The return value is an integer with the DC offset removed or filtered out. It will be positive if the raw reading is above 512, and negative if it is below. It needs to be very fast so that it can be called multiple times to sample the signal quickly enough.
Note: The data types and use of integer division are necessary to ensure the correct return.
int16_t intLowPass(int16_t* bias, int16_t raw) {
  *bias = (*bias + ((raw - *bias) / 1024)); // int division!
  return raw - *bias;
}
The next section in main() is where the ADC is sampled. Each reading from the filtered output is squared to remove any negative values and accumulated in a 32-bit wide variable which is large enough to hold all the samples.
 int32_t adc_sum_sqr = 0;
  for (int n = 0; n < NUM_OF_SAMPLES; n++)
  {
    int16_t adc_raw = analogRead(ADC_PIN);
    int16_t adc_filtered = intLowPass(&adc_bias, adc_raw);
    adc_sum_sqr += adc_filtered * adc_filtered;
  }
If you take the square root of the average reading and scale it by the Arduino supply voltage, you get the RMS voltage across the burden resistor. This is proportional to the primary current.
double vrms = sqrt(adc_sum_sqr / NUM_OF_SAMPLES) * ARDUINO_V / 1024.0;Multiply the burden voltage by the current ratio to get the primary RMS current:
double Irms = vrms * current_ratio;Multiply primary RMS current by the primary RMS voltage, and we have the power in Watts:
double active_power = Irms * MAINS_V_RMS;From this, the cost per kWh can be calculated and rounded for the display:
double rnd_cost = round(active_power * COST_PER_KWHR / 1000.0);All the rest of the code deals with managing and displaying the results on the EPD. Values need to be converted to strings for display purposes using the val_to_str() function.
Power and cost readings are displayed in small rectangular regions of the screen so they can be updated independently and overlaid on the background. Positioning them requires a bit of coordinate maths and is dependent on the orientation of the screen. When rotated 90 degrees clockwise, the origin becomes the bottom left of the panel.
The background is a static image generated by converting a black and white, 128 x 296 pixel jpeg image into a series of Hexadecimal bytes, 1 pixel per bit. The converted file is stored in its own header file, background.h.
There are several online converters that can do this – here is a good one.
To make your own background, create a 128 X 296 jpeg, import it and set the output to Horizontal 1 bit per pixel. Generate the output and then cut and paste the Hex bytes into background.h.
Before flashing the code, the Arduino IDE needs to be configured with support for the Arduino megaAVR boards using the Board Manager, and we set the Register Emulation to None to generate native ATMEGA4809 binaries.
Tip: When you flash the code, you might get error messages like the following, just ignore it and wait until the process is done. We had to press the upload key in the Arduino IDE a couple of times to get a successful flash sometimes:
avrdude: jtagmkII_initialize(): Cannot locate "flash" and "boot" memories in description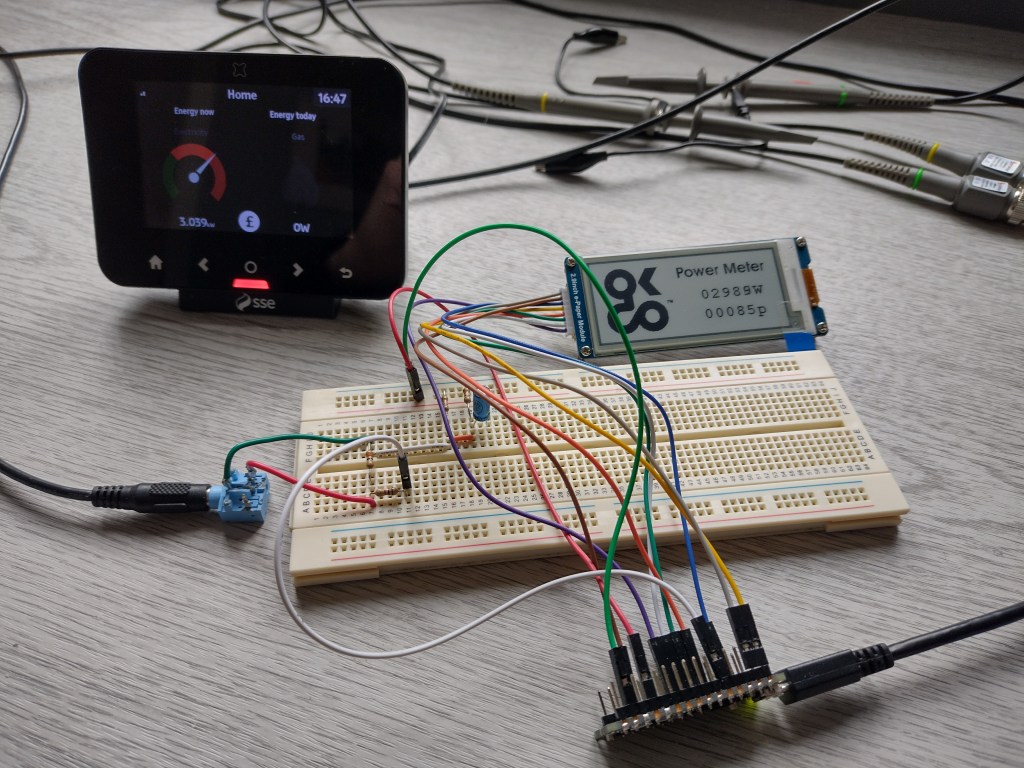
Step 7: Calibration
It is possible to get very accurate results that will closely match an energy supplier’s smart meter.
To calibrate, you need a large enough resistive load like a kettle and, if you have one, a smart meter for comparison. We used a 3kW kettle and smart meter to see if we were getting the expected results by checking the output on the serial monitor and the display.
For a 3kW kettle @ 240V RMS, a primary current of 12.5A RMS is expected:
Irms = 3000W / 240V = 12.5AFor our CT with 2000 turns this gives a secondary current in the burden resistor of 6.5mA.
irms = 12.5A / 2000 = 6.25mASo the voltage across a 33 Ohm burden resistor is 206mV.
vrms = 6.25mA x 33Ohms = 206mVNote: Turn off any other large appliances running on your electrical system while you do your calibration!
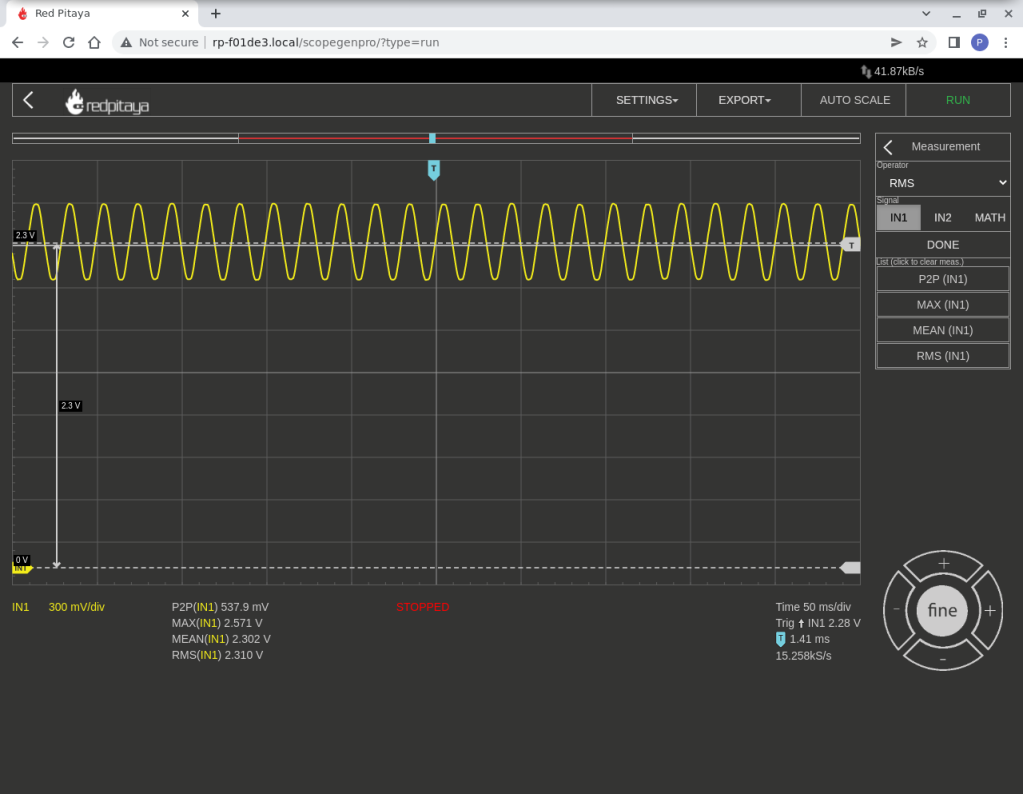
Turn on the kettle and check the serial monitor to see if you are getting the expected output of about 206mV – the reading will vary as it is calculated from an average. The Arduino supply voltage is the value affecting this part of the calculation. This will be slightly below 5V – we measured ours with a voltmeter across the 5V and GND pins and set the macro:
#define ARDUINO_V 4.8Once the burden voltage reading is accurate, the next thing to adjust is the burden resistor value. Nominally it is 33Ohms +/- 5% for a 5% tolerance resistor. Don’t try to measure it; adjust it up or down slightly to get the correct power reading. We set ours to 32.5 Ohms:
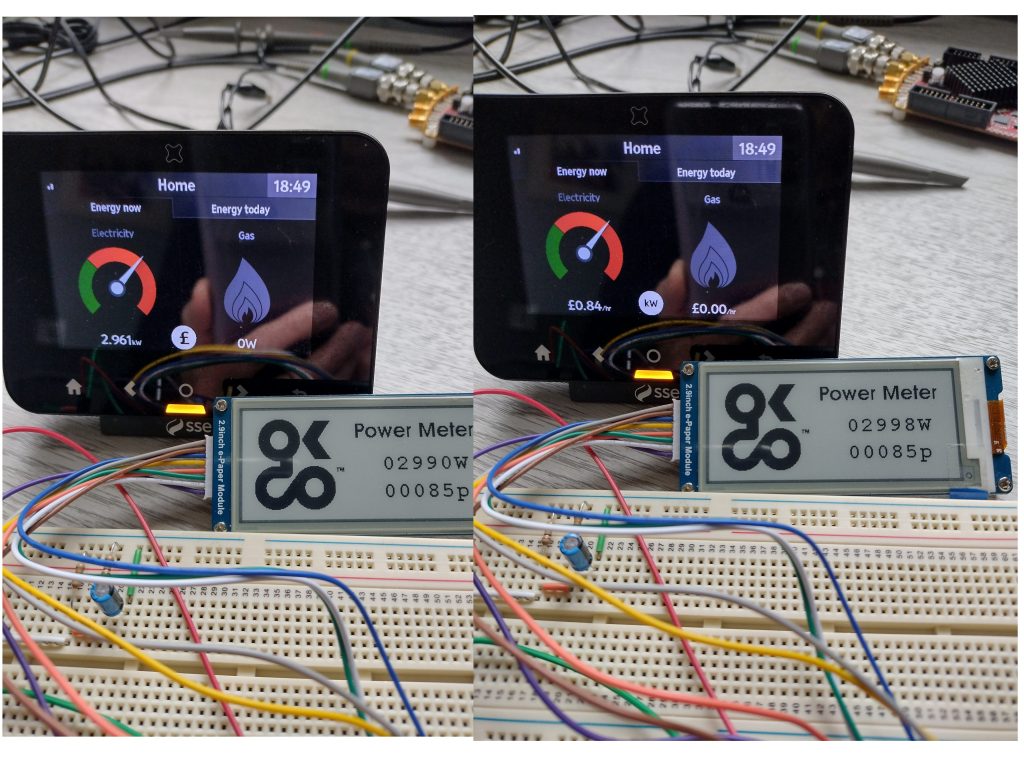
const float current_ratio = 2000.0 / 32.5;You should now have a power reading on the display that is comparable to your smart meter.
Make sure your electricity cost price is correct, and you should also get the correct cost per kWh displayed.
Once calibrated, you will get very reliable readings for all resistive loads running on your electrical system.
Note: Each time you change one of the values in the code, you need to re-flash the Arduino.
Testing the power and cost readings on our meter:
Summary
You don’t need many components to make an accurate energy monitoring meter, just an Arduino, a few resistors and a current transformer. Still, to get it to work properly, you need to understand quite a few important fundamental principles, which is what makes this project so interesting.
It uses a resistor divider and DC bias circuit to condition an AC voltage so that it can be measured using the Arduino’s onboard ADC. Then, you need to code the maths to filter out the DC offset to digitise the signal and apply Ohm’s Law and a bit of AC power theory, and you have your meter working. With some careful calibration, you should be able to get very close to the readings on a smart meter.
The project allows you to have clear visibility over the energy consumption of each of your home appliances, protect the environment and reduce electricity costs by optimising the daily power consumption and saving energy.
References
Here are a few references with further technical details:
Remember, always take care when dealing with mains voltages!
![]()
Are you looking for more components for your next exciting project? Discover our whole range of Arduino boards and compatible products that will help you be successful in your future projects & ideas.

Are you ready to embrace a new challenge? Visit our Projects Hub and get inspired to jump onto your next project.
Like what you read? Why not show your appreciation by giving some love.
From a quick tap to smashing that love button and show how much you enjoyed this project.

